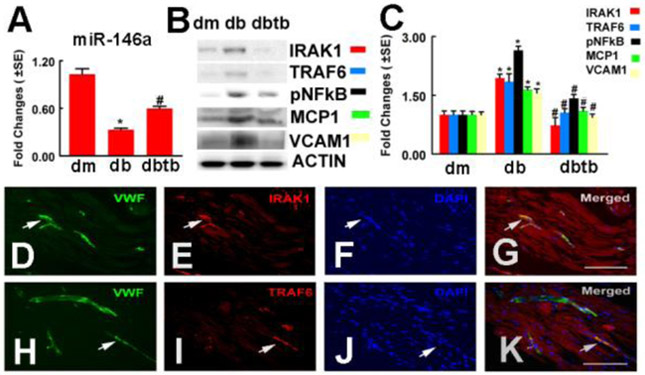
Fig.1: Tβ4 treatment increased miR-146a level and decreased IRAK1, TRAF6 and p-NFkB expression, as well as MCP-1 and VCAM-1 levels in sciatic nerve tissues.
Panels A to C show real-time RT-PCR analysis of miR-146a expression (A) and Western blot analysis of IRAK1, TRAF6 and p-NFkB, as well as MCP-1 and VCAM-1 levels in the sciatic nerve tissues, β-actin was used as an internal control (B and C). Double immunofluorescent staining shows that IRAK1 (E, G red, arrows) and TRAF6 (I, K, red, arrows) immunoreactivity were localized to vWF positive vessels (D, G, H, K green, arrows). Panels F and J show DAPI nuclear staining (blue). *p<0.05 and #p<0.05 versus the db/m mouse and the saline treated db/db mouse, respectively. n=6/group. Bar=100 μm. dm=db/m mouse; db=db/db mouse. dbtb=diabetic mouse treated with Tβ4.

