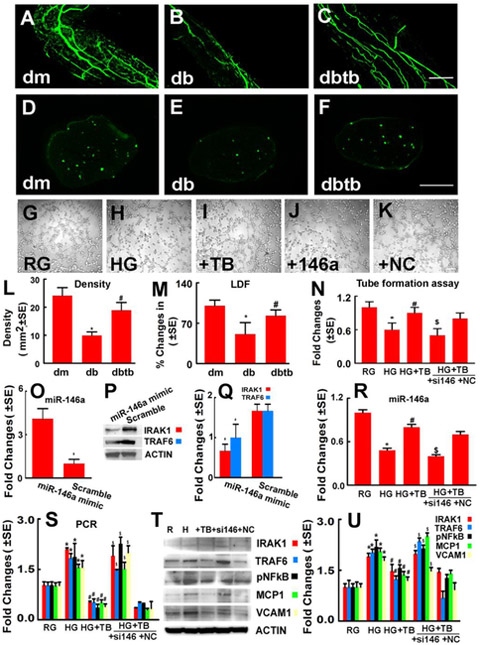
Fig.2: miR-146a mediates Tβ4-improved vascular function in the diabetic sciatic nerve.
Panels A to F show that whole-mounted (A to C) and cross sections (D to F) of the sciatic nerve tissues revealed FITC-dextran perfused vessels from a representative dm mouse (A, D), db mouse treated with saline (B, E), and db mouse treated with Tβ4 (C,F). Panels L and M show quantitative data of the density of FITC-dextran perfused vessels in cross section (L, n=6/group) and percentage changes of sciatic nerve tissue blood flow with a reference of dm mice at 100% (M, n=6/group). *p<0.05 and #p<0.05 versus the db/m mouse and the saline treated db/db mouse, respectively. Bar=100μm. dm=db/m mouse; db=db/db mouse. dbtb=diabetic mouse treated with Tβ4. Panels G to K show representative microscopic images (G-K ) and quantitative data (N) of capillary-like tube formation in MDEs cultured in normal glucose (RG), high glucose (HG), high glucose with Tβ4 (HG+TB), high glucose with Tβ4 in the presence of miR-146a inhibitor (+si146) and scramble negative control (+NC). Bar in K=50μm. Panel O shows quantitative data of real-time RT-PCR analysis of miR-146a expression in MDEs. Panels P and Q show Western blot analysis of IRAK1 and TRAF6 levels in MDEs transfected with miR-146a mimics and scramble control, respectively. Panel R shows quantitative data of real-time RT-PCR analysis of miR-146a expression in MDEs. Panels S to U show quantitative data of real-time RT-PCR (S) and Western blot analysis (T and U) of IRAK1,TRAF6, p-NFkB, MCP-1 and VCAM-1 levels in MBEs under different conditions, and HSC70 and β-actin were used as internal controls, respectively. *p<0.05, #p<0.05 and $p<0.05 versus the normal glucose (RG), high glucose (HG) and scramble negative control (NC) groups, respectively. n=6/group.

