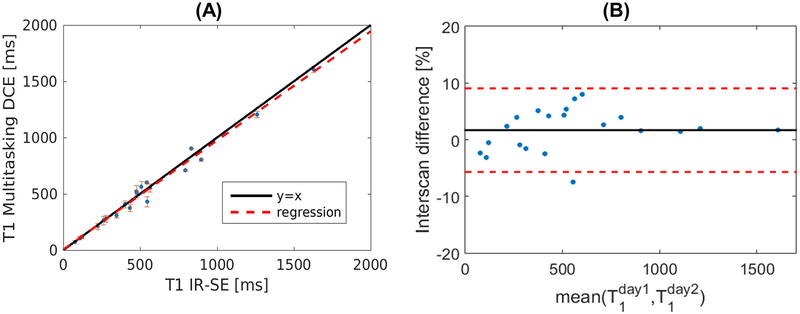
Figure 2:
Phantom measurements. (A): Comparison of T1 quantification using the proposed Multitasking DCE versus a standard reference method (IR-spin echo). The solid black line represents y = x while the dashed red lines stands for the regression of the results from two methods (R2 = 0.96). The error bar shows the standard deviation for each measured T1. (B): The Bland–Altman plot shows reproducibility of the T1 measurement of the proposed protocol measured on two different days. Solid line and dashed lines indicate the means and standard deviation of the T1 values between different measurement, respectively.

