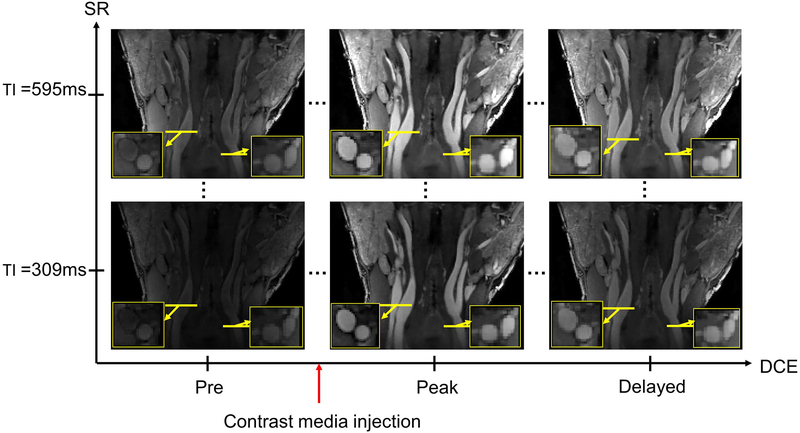
Figure 3:
Representative image set from a study of a normal subject using the proposed method. Multi-phase images are reconstructed with the LRT framework in the SR dimension (images at different TI times) and dynamic enhancement dimension (images at different time after injection). Zoomed-in images are the transversal view of the locations marked by yellow lines. Multiple SR phases allows T1 quantification and direct estimation of contrast concentration. Three key DCE phases are shown along horizontal axis, including pre-injection, peak enhancement, and washing out. DCE temporal footprint is 1.2 s.

