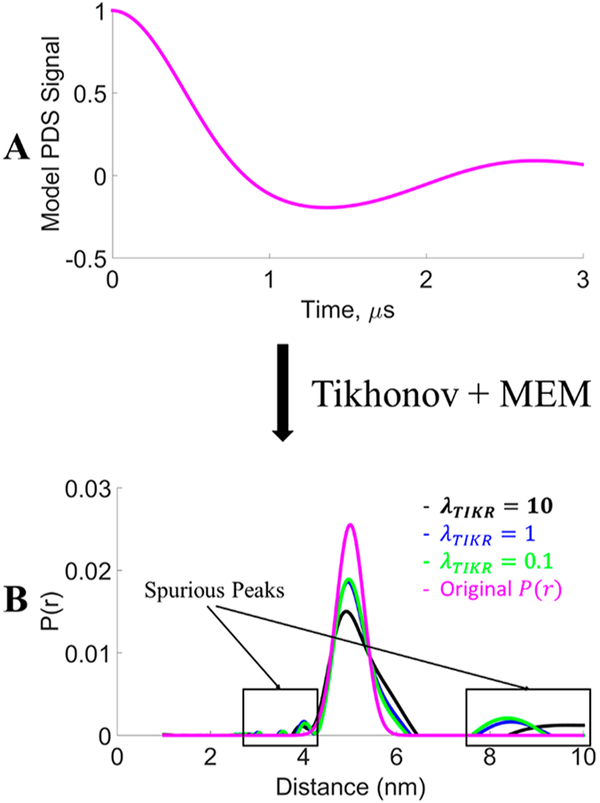
Figure 1.
Comparison of distance distributions of a model signal (A) using Tikhonov regularization with different λ values. The model P(r) is a Gaussian distribution centered at 5 nm with standard deviation of 0.3 nm (B). The maximum entropy method (MEM)28 was used to constrain P(r) ≥ 0, suppressing the regions of P(r) < 0 in the original Tikhonov result. Reprinted with permission from ref 17. Copyright 2017 ACS.

