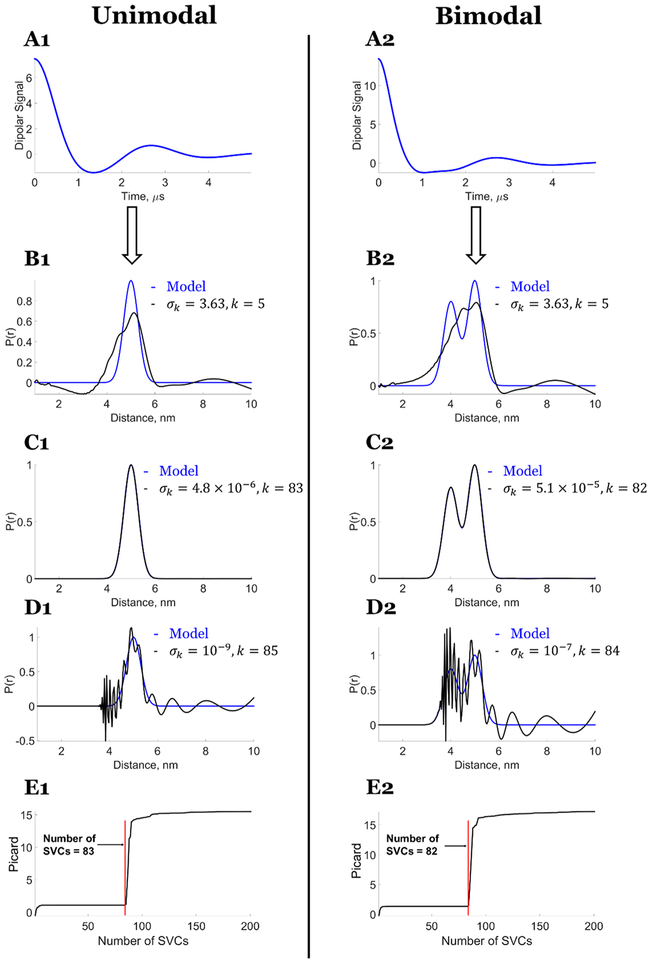
Figure 2.
Model data: Exact solution using the SVD method: P(r) versus number of singular value contributions (SVCs). Unimodal distance distribution: (A1) Noise-free dipolar signal. Comparison of model distribution with P(r) generated from (B1) fewer SVCs k = 3, σk = 8.04, (C1) exact solution obtained for k = 83, σk = 4.8 × 10⁻⁶, (D1) more SVCs k = 85, σk = 10−9, and (E1) Picard plot of versus the number of singular values from k = 1 to 200 starting from largest value. It shows the contributions of singular values that lead to stable and unstable distributions. Bimodal distance distribution: (A2) Noise-free dipolar signal. Comparison of model distribution with P(r) generated from (B2) fewer SVCs k = 3, σk = 8.04, (C2) exact solution obtained for k = 82, σk = 5.1 × 10, (D2) more SVCs k = 84, σk = 10−7, and (E2) Picard plot of versus the number of singular values from k = 1 to 200 starting from largest value. It shows the contributions of singular values that lead to stable and unstable distributions.7 Reprinted with permission from ref 7.

