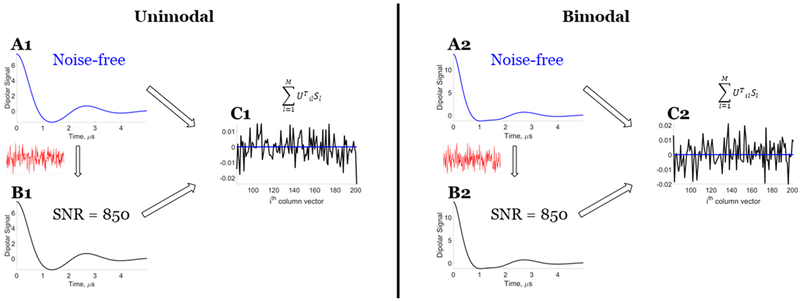
Figure 3.
Model data: Orthogonality validation for the noiseless data and data with some noise (SNR ≈ 850). Unimodal distance distribution: (Al) noiseless data, (B1) data with some noise, and (C1) comparison of results of at the ith column vector for noiseless data and data with some noise. Bimodal distance distribution: (A2) noiseless data, (B2) data with some noise, and (C2) comparison of results of at the ith column vector for noiseless data and data with some noise. Signal in red is noise added to the noise-free data (blue) to obtain data with some noise (black). The orthogonality requirement shown in panel C is clearly met for the noiseless data but not for data with some noise. Reprinted with permission from ref 7.

