Figure 8.
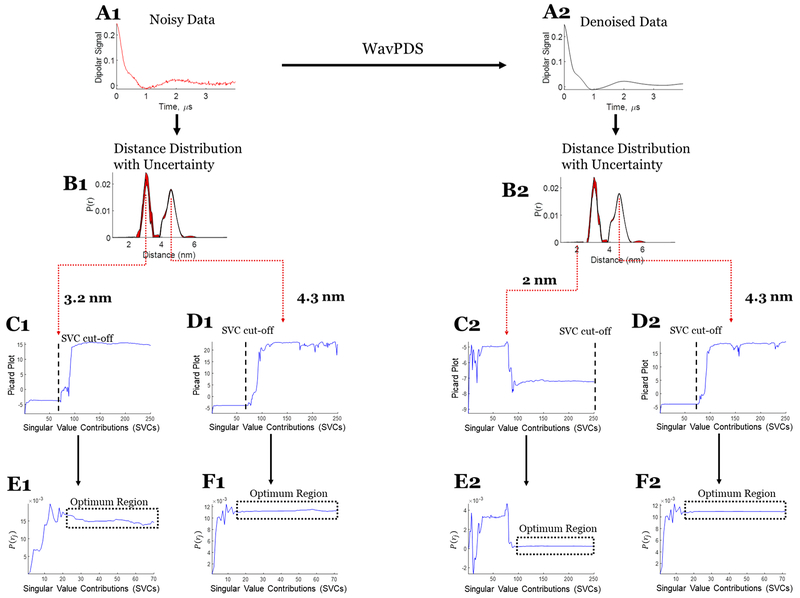
Case 2: SVD reconstruction with uncertainty analysis of the noisy and denoised dipolar signal for bimodal distribution. (A1) Noisy data. (B1) Distance distribution from noisy data with uncertainty (in red). (C1) Modified Picard plot for the 3.2 nm distance, revealing the singular value cutoff before which solution at this distance diverges. (D1) Modified Picard plot for the 4.3 nm distance, revealing the singular value cutoff before which solution at this distance diverges. (E1) P(r) values obtained at the 3.2 nm distance by different SVCs until the SVC cutoff; if it never diverges, as in this case, then the last SVC is selected as cutoff. (F1) P(r) values obtained at the 4.3 nm distance by different SVCs until the SVC cutoff. (A2) Denoised data using WavPDS. (B2) Distance distribution from denoised data with uncertainty (in red). (C2) Modified Picard plot for the 2 nm distance, revealing that the solution for this distance never diverges. Hence, the last data point is selected as SVC cutoff. (D2) Modified Picard plot for the 4.3 nm distance, revealing the singular value cutoff before which solution at this distance diverges. (E2) P(r) values obtained at the 2 nm distance by different SVCs until the SVC cutoff; if it never diverges, as in this case, then the last SVC is selected as cutoff. (F2) P(r) values obtained at the 4.3 nm distance by different SVCs until the SVC cutoff.

