Fig. 2.
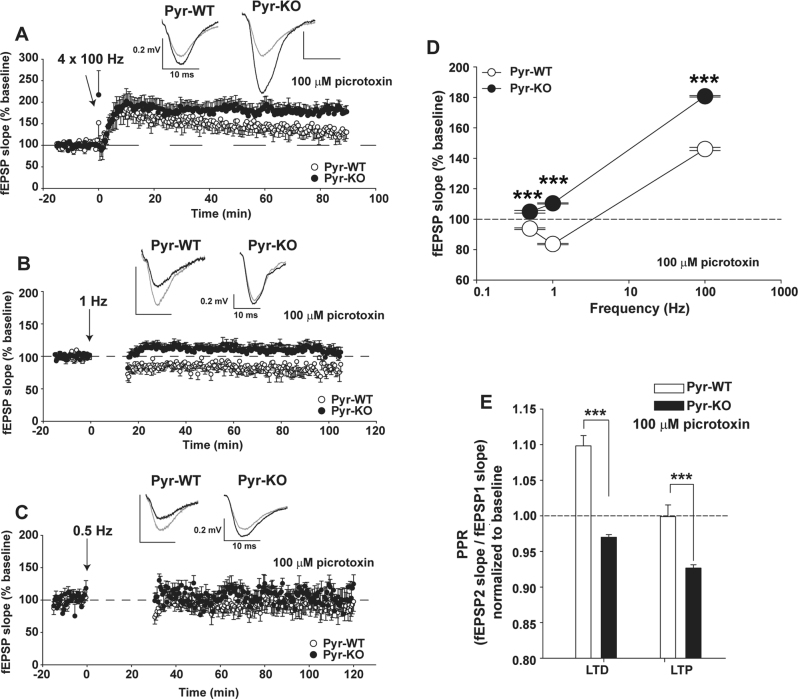
Deficient LTD and increased LTP with conditional deletion of PirB in forebrain excitatory neurons. a LTP at CA3-CA1 synapses in CamKIIa-Cre; PirB + / + (Pyr-WT) vs. CamKIIa-Cre; PirB fl/fl (Pyr-KO) induced with 4 × 100 Hz. Pyr-WT LTP: 146.19 ± 1.3 % (n = 8 slices/5 mice). Pyr-KO LTP: 180.7 ± 1.35 % (n = 8 slices/3 mice); p < 0.001. b LTD induced with 900 pulses at 1 Hz. Pyr-WT LTD: 83.9 ± 0.65 % (n = 12 slices/6 mice) vs. Pyr-KO LTD: 110.4 ± 0.61 % (n = 16 slices/6 mice); p < 0.001. c Same as (b), but LTD induction using 0.5 Hz. Pyr-WT LTD 0.5 Hz: 93.7 ± 1.15 % (n = 9 slices/5 mice) vs. Pyr-KO LTD 0.5 Hz: 104.8 ± 1.08 % (n = 5 slices/3 mice); p < 0.001. d Summary of LTP and LTD vs. the frequency of induction in Pyr-WT vs. Pyr-KO. Absence of LTD in Pyr-KO is evident for a range of frequencies from 0.5 to 400 Hz. e Bar-graphs of average paired-pulse ratios (PPR). Pyr-WT LTD: 1.10 ± 0.01 (n = 12 slices, 6 mice) vs. Pyr-KO LTD: 0.970 ± 0.003 (n = 16 slices, 6 mice); p < 0.001. Pyr-WT LTP: 0.999 ± 0.16 (n = 8 slices, 5 mice) vs. Pyr-KO LTP: 0.927 ± 0.004 (n = 8 slices, 3 mice), p < 0.001, ***p < 0.001. Test: 2-Way RM Anova. Mean values are averages of fEPSP slopes or PPR measured between 20–90 min post-induction. Insets: fEPSP trace examples from Pyr-WT and Pyr-KO slices before (gray line) and after induction (black line) of LTP (a) or LTD (b, c); each trace is average of 30 individual traces taken at baseline or 75–90 min post-induction.

