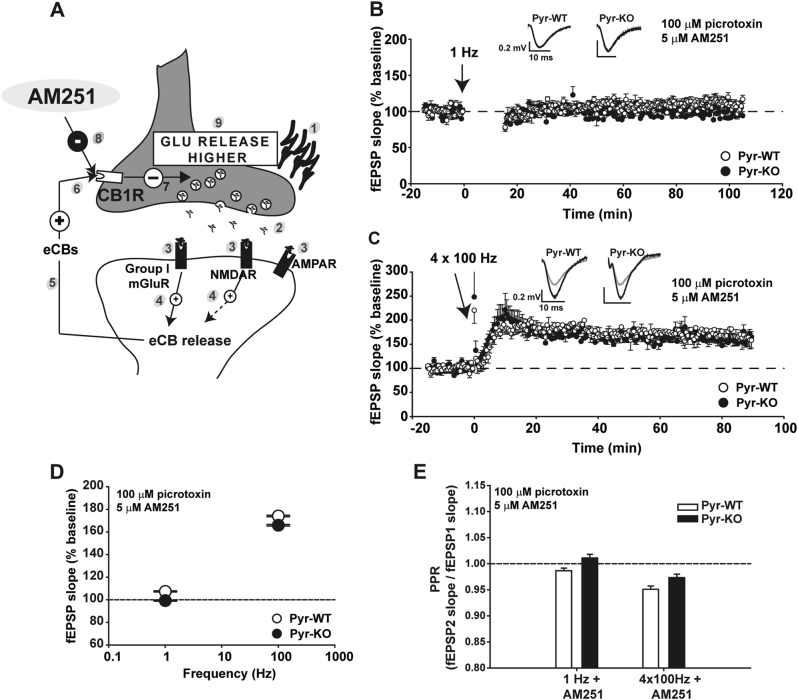
Fig. 3.
Blockade of CB1R in Pyr-WT phenocopies LTP and LTD alterations in Pyr-KO. a Cartoon illustrating synthesis and retrograde release of eCBs following a plasticity-inducing stimulus. Synaptic stimulation [1] triggers release of glutamate [2] which binds to postsynaptic AMPAR, NMDAR and Group I mGluRs [3]. Signaling downstream of NMDAR and Group I mGluRs elicits endogenous cannabinoid synthesis (eCBs) and release [4, 5], and binding to presynaptic CB1 receptor (CB1R) [6]. CB1R activation decreases neurotransmitter release [7]. Application of AM251 (a CB1R inverse agonist) depresses CB1R activation [8] and generates higher than normal glutamate release [9]. b LTD (1 Hz) of CA3-CA1 synapses is abolished in Pyr-WT with addition of 5 µM AM251 (107.4 ± 0.57 % baseline; n = 10 slices/4 mice); 1 Hz stimulation in Pyr-KO in the presence of AM251 resulted in the post-induction fEPSP slope of 99.2 ± 0.63 % baseline (n = 8 slices/4 mice). c LTP in Pyr-WT in the presence of 5 µM AM251 (174.1 ± 1.2 %; n = 13 slices/5 mice) increases relative to LTP in control conditions (146.19 ± 1.3 % from Fig. 2a, p < 0.001, 2-Way RM Anova), and even slightly surpasses the LTP measured in Pyr-KO in the presence of 5 µM AM251 (165.8 ± 1.5%; n = 8 slices/3 mice; p < 0.001, 2-Way RM Anova). d Summary of LTP and LTD vs. frequency of induction in Pyr-WT vs. Pyr-KO in presence of 5 µM AM251. Absence of LTD is now evident in both Pyr-KO and Pyr-WT. e PPR in AM251. Differences in PPR in Pyr-WT vs. Pyr-KO after induction of LTD and LTP seen in control conditions (Fig. 2e) are abolished in the presence of AM251.PPR after 1 Hz: Pyr-WT 0.99 ± 0.01 (n = 10 slices/ 4 mice) vs. Pyr-KO, 1.01 ± 0.01 (n = 8 slices/ 4 mice); p = 0.02. PPR after 4 × 100 Hz: Pyr-WT: 0.95 ± 0.01 (n = 13 slices, 5 mice) vs. Pyr-KO: 0.97 ± 0.01 (n = 8 slices, 3 mice); p = 0.015. Test: 2-Way RM Anova. Means are averages from 20 to 90 min post-induction. Insets: fEPSP trace examples from Pyr-WT and Pyr-KO slices before (gray line) or after induction (black line) of LTD (b) or LTP (c); each trace is average of 30 individual traces taken at baseline or at 75–90 min post-induction.

