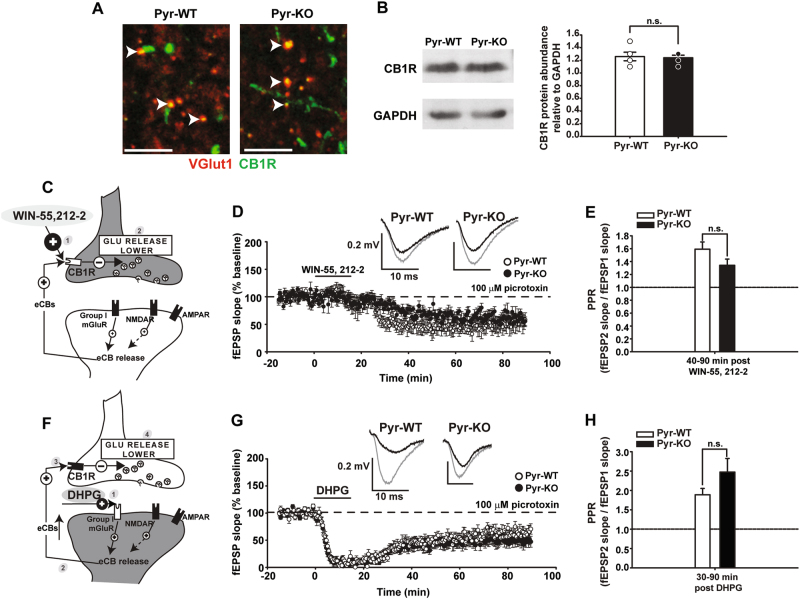
Fig. 4.
Activation of CB1R and group I mGluR, obligatory components of endocannabinoid system in CA3-CA1, is similar between Pyr-WT and Pyr-KO. a Fluorescent micrographs of CA1 St. radiatum from Pyr-WT (left) and Pyr-KO (right) showing VGlut1 (red) and CB1R immunostaining (green). Overlap of the two signals is yellow. No apparent difference is detectable between the two genotypes. Calibration bar: 5 µm. b Western Blot analysis for CB1R, relative to GAPDH, for Pyr-WT and Pyr-KO. Left—image of a representative gel showing CB1R specific and GAPDH specific bands. Right—bar graph of relative CB1R protein abundance in Pyr-WT (1.26 ± 0.07, n = 5) vs. Pyr-KO (1.24 ± 0.04, n = 5), p = 1.000, U-test. c Cartoon of CA3-CA1 synapse depicting effect of CB1R agonist WIN-55,212-2 [1] on CB1R activation, resulting in lower glutamate release [2]. d 15 min bath application of 5 µm WIN-55,212-2 generates persistent WIN-LTD in Pyr-WT (49.4 ± 0.95 %; n = 8 slices/4 mice; p < 0.001 relative to baseline) and Pyr-KO (65.9 ± 0.89 %; n = 7 slices/3 mice; p < 0.001 relative to baseline). e Average PPR for WIN-LTD in Pyr-WT: 1.59 ± 0.11 (n = 8 slices/4 mice) vs. Pyr-KO: 1.34 ± 0.10 (n = 7 slices/3 mice); p = 0.10. f Cartoon depicting effect of Group I mGluR agonist DHPG [1] on eCB release [2], eCB binding to CB1R [3] and lower glutamate release [4]. g 15 min bath application of 100 µm DHPG resulted in prominent DHPG-LTD in both Pyr-WT (53.25 ± 0.8 %; n = 11 slices/ 4 mice; p < 0.001 relative to baseline; one-way Anova) and Pyr-KO (45.1 ± 0.80%; n = 11 slices/ 4 mice; p < 0.001 relative to baseline; one-way Anova). h Average PPR after DHPG application. During DHPG-LTD (30–90 min post DHPG), PPR in Pyr-WT: 1.89 ± 0.16 (n = 11 slices, 4 mice) vs. PPR in Pyr-KO: 2.47 ± 0.35 (n = 11 slices, 4 mice); p = 0.621. 2-Way RM Anova. Insets: fEPSP trace examples from Pyr-WT and Pyr-KO slices before (gray line) and after induction (black line) of WIN-LTD (d) or DHPG-LTD (g); each trace is average of 30 individual traces taken at baseline or at 75–90 min post-induction.

