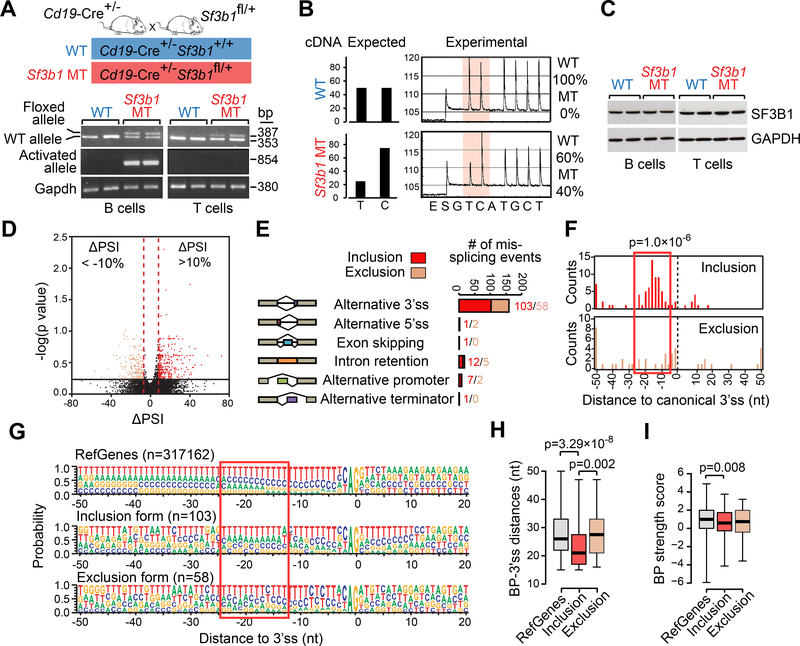
Figure 1. Conditional expression of Sf3b1-K700E in mouse B cells.
(A) PCR of genomic DNA from B and T cells from mice with WT or MT Sf3b1 to detect the floxed allele and the activated Sf3b1-K700E allele. (B) The percentages of WT or MT Sf3b1 alleles from pyrosequencing profiles in B cells are shown. (C) Western blot of SF3B1 in B cells and T cells with WT and MT Sf3b1 are shown. Two biological replicates are shown for each group. (D) Volcano plot shows ΔPSI versus log10 (p value) of all splicing changes identified by JuncBASE. Events with |ΔPSI|>10% and p<0.05 were considered significant. (E) Different categories of mis-splicing events in MT versus WT cells are shown. Events with ΔPSI>10% were defined as inclusion and events with ΔPSI<−10% were defined as exclusion in MT compared to WT cells. (F) Histogram shows the distance between the alternative and canonical 3’ss. The 0 point defines the position of the canonical 3’ss. (G) Sequence motifs around all RefGene 3’ss, MT inclusion 3’ss and MT exclusion 3’ss are shown. The height of each letter indicates the probability that nucleotide is used at that position. The red box highlights the region with heightened usage of adenosine upstream of the inclusion 3’ss. (H) The distance between the predicted branch point and the corresponding 3’ss are shown. The 0 point defines the position of the 3’ss. (I) The strength of the branch point associated with different groups of 3’ss are shown. In H and I, center lines show the means; box limits indicate the 25th and 75th percentiles and whiskers extend to minimum and maximum values. See also Figures S1 and S2, and Table S1.

