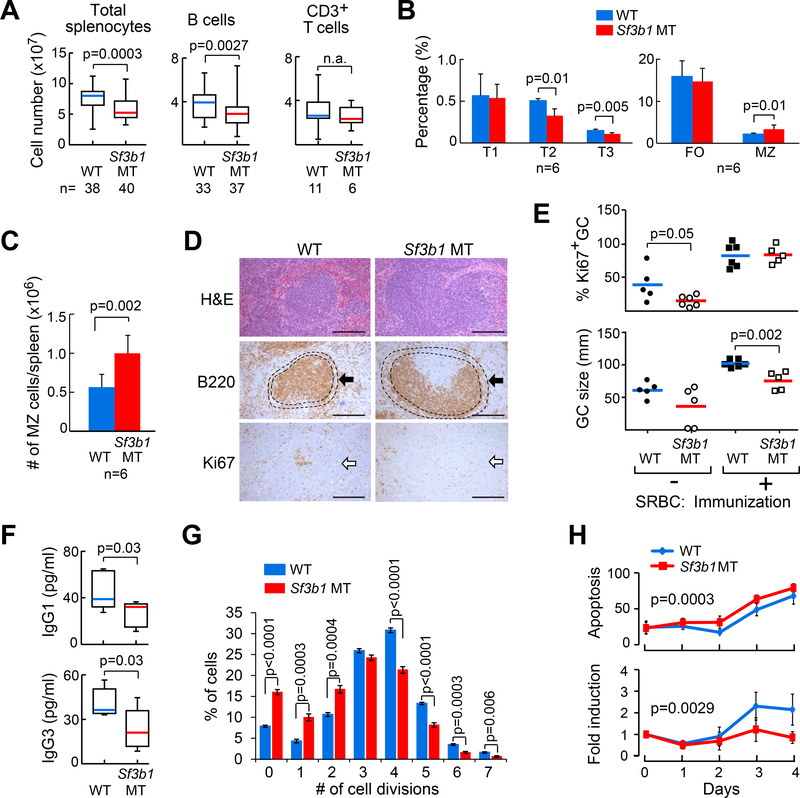
Figure 2. Expression of Sf3b1-K700E affects B cell proliferation in vitro and in vivo.
(A) The number of total splenocytes, splenic B cells and CD3+ T cells in WT and Sf3b1 MT mice are shown. Center lines indicate the means; box limits indicate the 25th and 75th percentiles; whiskers extend to minimum and maximum values. (B) The percentages of different B cell populations in the spleens of WT and Sf3b1 MT mice are shown. T1-T3: transitional B cells, FO: follicular B cells, MZ: marginal zone B cells. (C) The absolute counts of marginal zone B cells per spleen are shown. Average and standard deviation are plotted. For both B and C, data represent Mean±SD of results derived from 6 WT and 6 MT mice, and were analyzed using Student’s t-test. (D) Hematoxylin and Eosin (HE) staining and immunohistochemical staining of spleen sections from WT and MT mice are shown. Arrow indicates marginal zone stained with an α-B220 antibody. Proliferative germinal centers were stained with an α-Ki67 antibody. Scale bar: 250 μm. (E) The percentage and size of germinal centers identified by Ki67 staining in WT and Sf3b1 MT mice are shown. Center lines indicate the means. (F) Abundance of serum IgG3 and IgG1 antibodies in WT (n=9) and Sf3b1 MT (n=7) mice are shown. Center lines indicate the means; box limits indicate the 25th and 75th percentiles; whiskers extend to minimum and maximum values. (G) WT and Sf3b1 MT cells were stimulated with LPS+IL4 for 3 days in vitro and multiple generations were traced using CellTrace violet dye dilution and flow cytometry. Data represent Mean±SD of results derived from 5 WT and 5 MT mice, and were analyzed using ANOVA. (H) Apoptosis and proliferation of cells described in (G) are shown. Apoptosis rates were determined by Annexin V staining and flow cytometry. Data represent Mean±SD of results derived from 6 WT and 7 MT mice. See also Figure S3.

