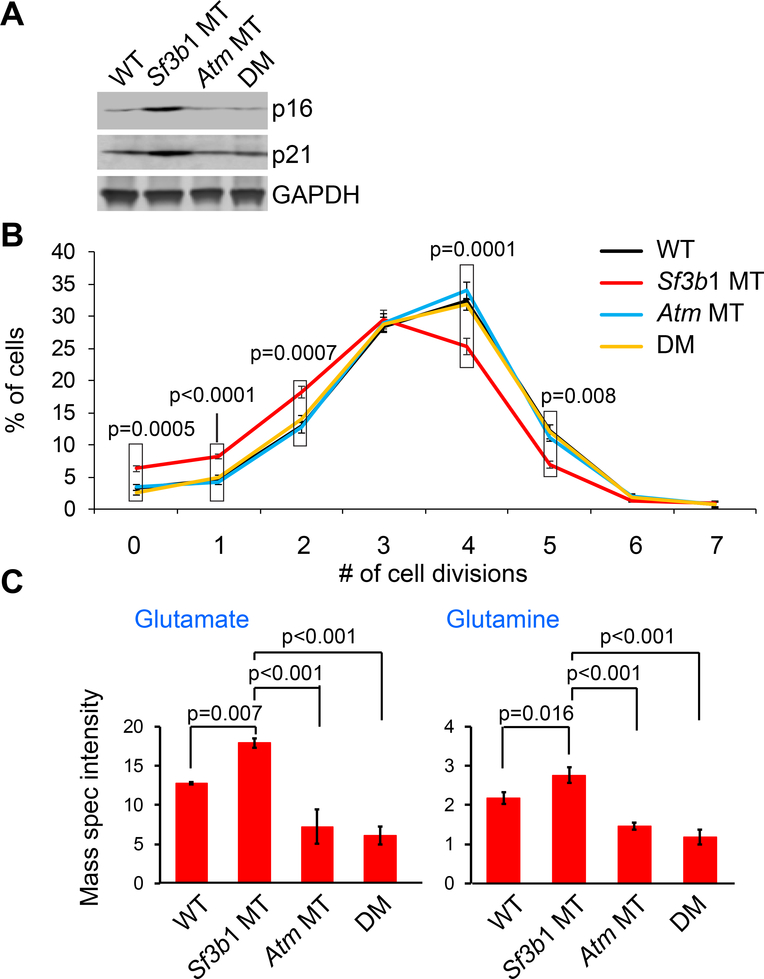
Figure 3. Atm deletion overcomes Sf3b1 mutation induced-cellular senescence.
(A) Western blot of senescence markers p16 and p21 in B cells from the different groups of mice are shown. (B) The percentage of B cells undergoing different numbers of cell divisions upon stimulation with LPS+IL4 were shown. Data represent Mean±SD of three replicates. The p values indicate the difference between Sf3b1 MT and other groups in each division point, using ANOVA. (C) Abundance of glutamate and glutamine in splenic B cells from the different mice groups are shown. Data represent Mean±SD of mass spectrometry intensities of three replicates and were analyzed using a one-way ANOVA with the Scheffe correction for multiplicity of testing. See also Figures S4.

