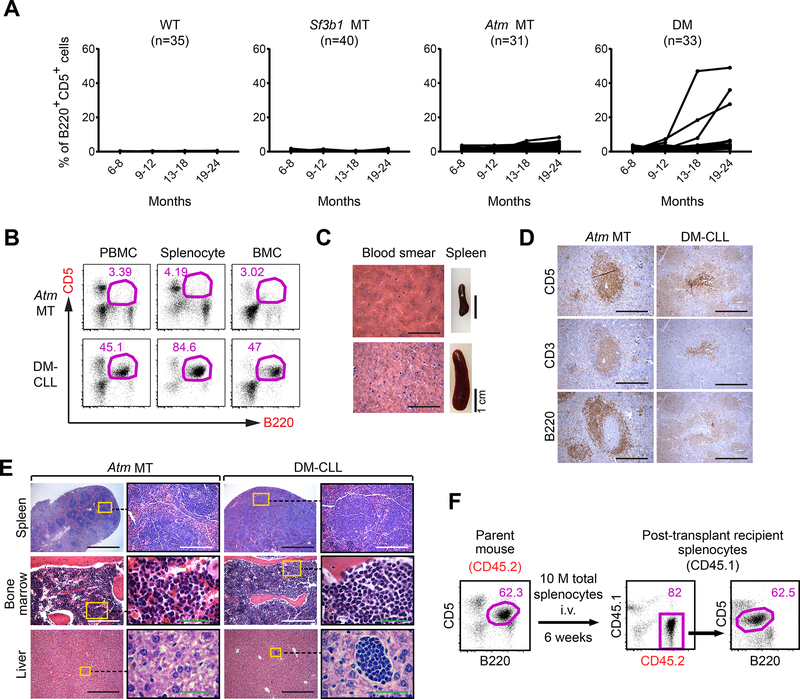
Figure 4. Combined Sf3b1 mutation and Atm deletion cause CLL.
(A) The percentage of CLL-like cells (B220+CD5+) within the lymphocyte population in the different groups of mice over time are shown. (B) Flow cytometry data identified B220+CD5+ cells within peripheral blood mononuclear cells (PBMCs), splenocytes and bone marrow mononuclear cells (BMCs) of Atm MT and DM-CLL mice. (C) H&E staining of blood smears and spleen of Atm MT and DM-CLL mice are shown. Scale bar for blood smear images:1 mm. (D) Immunohistochemical staining show CD5, CD3 and B220 signals on the consective sections of spleens from Atm MT and DM-CLL mice. Scale bar: 250 μm. (E) H&E staining shows leukemia cells infiltration in the spleen, bone marrow and liver tissues in the Atm MT and DM-CLL mice. Black scale bar: 1 mm; White scale bar: 250 μm; Green scale bar: 50 μm. (F) 10 million total splenocytes and bone marrow cells from a DM-CLL mouse were engrafted into either immunodeficient (NSG) or immunocompetant (CD45.1) mice 6 weeks after the engraftment. mice were sacrificed and B220+CD5+ in the spleen were detected by flow cytometry. See also Figure S5 and Table S2.

