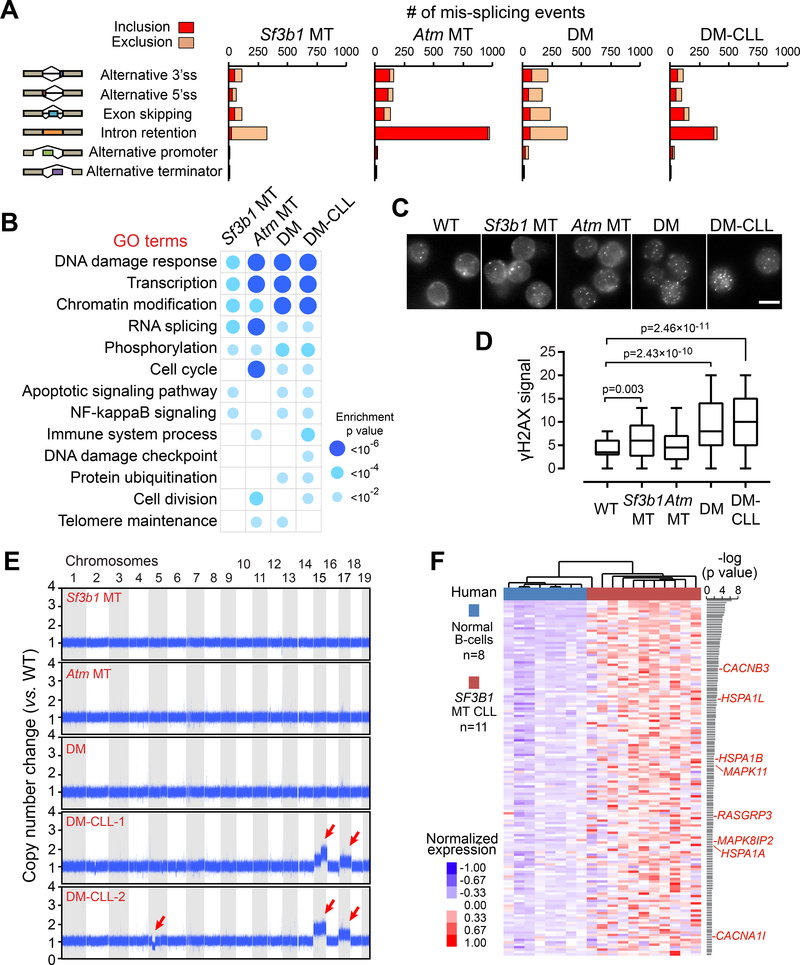
Figure 5. Sf3b1 mutation and Atm deletion are associated with increased DNA damage.
(A) The number of alternative splicing events significantly included or excluded in MT groups versus WT are shown. (B) Top Gene Ontology categories significantly enriched for mis-spliced transcripts in different MT versus WT groups are shown. (C) Representative data of γH2AX immunofluoresent staining in splenic B cells obtained from WT and different MT mice. Scale bars, 5 μm. (D) γH2AX signal intensities in WT and different MT mice. 70–91 cells were measured for each group. Center lines show the medians, box limits indicate the 25th and 75th percentiles and whiskers extend to minimum and maximum values. (E) Chromosomal copy number variants are detected using whole-genome sequencing. The copy number ratio to WT mice are shown. Red arrows indicate chromosome amplification and deletions. (F) Heatmap showing the normalized gene expression of 146 human genes (homologs of mouse Chr 15 and 17 genes) significantly upregulated (p<0.05) in 11 human CLL with SF3B1 mutations versus 8 normal B cells. Genes involved in MAPK/ERK signaling are labeled red. See also Figure S6 and Tables S3–S5.

