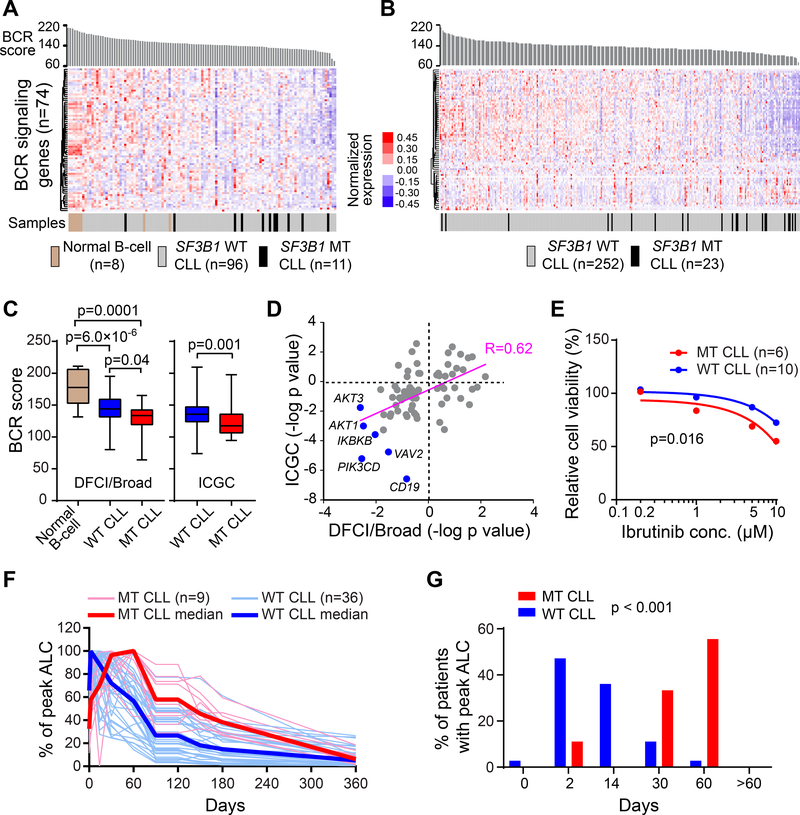
Figure 7. Distinct patterns of BCR signaling in CLL cells with SF3B1 mutation.
(A and B) Heatmap of the expression of BCR signaling pathway genes in DFCI/Broad cohort (n=115) (A) and ICGC cohort (n=275) (B). Samples were ranked by BCR scores, which indicate the mean TPM of 74 BCR signaling genes within individual samples. (C) Statistics of the BCR scores in different groups are shown. Center lines indicate the means; box limits indicate the 25th and 75th percentiles; whiskers extend to minimum and maximum values. (D) Correlation between changes in the expression of BCR signaling pathway genes in the two CLL patient cohorts. Positive log-transformed p values indicate upregulation and negative values indicate downregulation in SF3B1 MT compared to WT CLLs. (E) 6 SF3B1 MT and 10 WT human CLLs treated with different doses of ibrutinib for 48 hr in vitro, and the relative cell viability compared to the DMSO control group were calculated. The mean percentage viability of all SF3B1 WT or MT CLL samples upon ibrutinib treatment is shown. (F) Changes in absolute lymphocyte count (ALC) overtime in 36 cases and 9 cases with WT and MT SF3B1, respectively, CLL treated with ibrutinib. ALC was measured by 2, 14 days and 1, 2, 3, 4, 5, 6 and 12 months on ibrutinib and was presented as percentage of the peak ALC for individual cases (thin red lines, MT CLLs; thin blue lines, WT CLLs). Red line - Median values of all MT CLLs; blue line – median value of all WT CLLs. (G) The percentage of cases reaching peak circulating ALC at each time point. All cases reached their peak by 60 days; p value was calculated using the Kruskal-Wallis test. See also Figure S7 and Table S7

