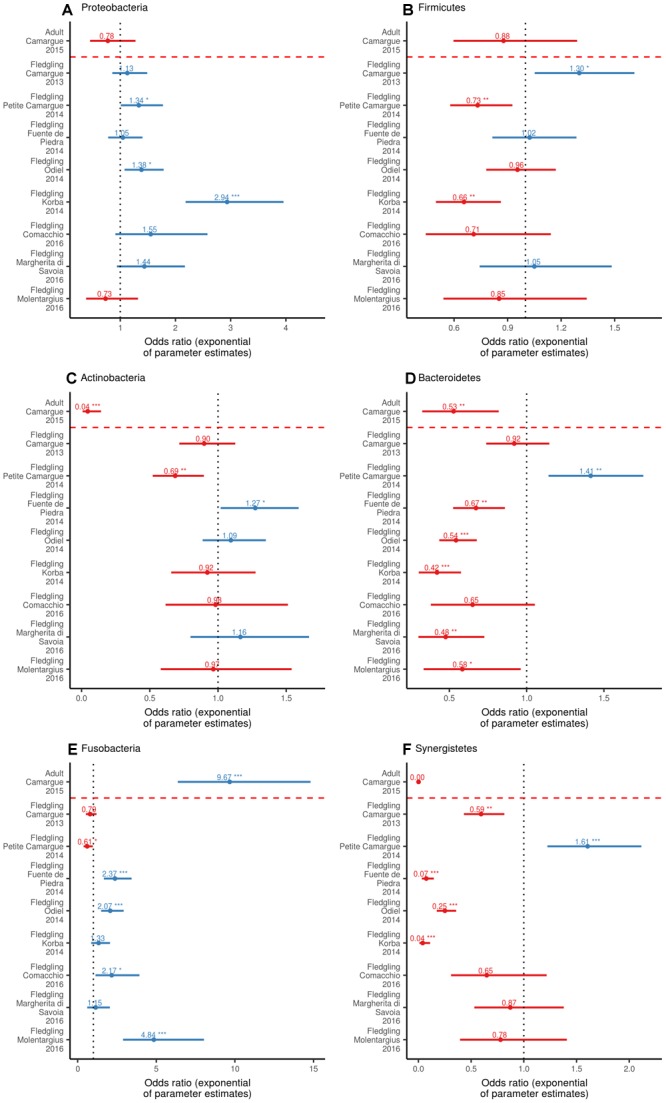
FIGURE 4.

Odds ratio (exponential of parameter estimates) of the GLM (with a Binomial distribution and logit link function) of the relative abundance of ASV belonging to phylum within individual according to sampling unit for Proteobacteria (A), Firmicutes (B), Actinobacteria (C), Bacteroidetes (D), Fusobacteria (E), and Synergistetes (F). The intercept (dotted black line) is fledgling samples from Camargue in 2015. Odds ratio values are displayed as well as significance relative to the intercept (∗p = 0.05, ∗∗p = 0.01, ∗∗∗p < 0.001). The dashed red line separates adult samples from fledgling samples.
