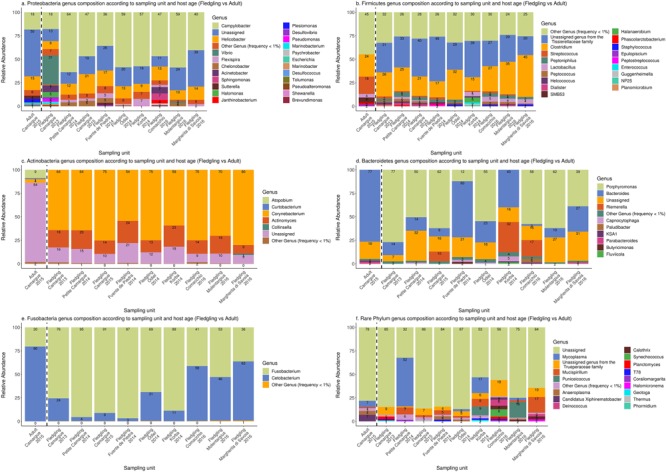
FIGURE 5.

Genus composition with the five most common phyla Proteobacteria (a), Firmicutes (b), Actinobacteria (c), Bacteroidetes (d), and Fusobacteria (e) and the other phyla pooled together (f). Only genera with a frequency of at least 1% are represented. Synergistetes was not plotted since it was dominated by a single ASV. Numbers within barplot represent the relative abundance of each genus within the phylum. The dashed black line separates adult samples from fledgling samples.
