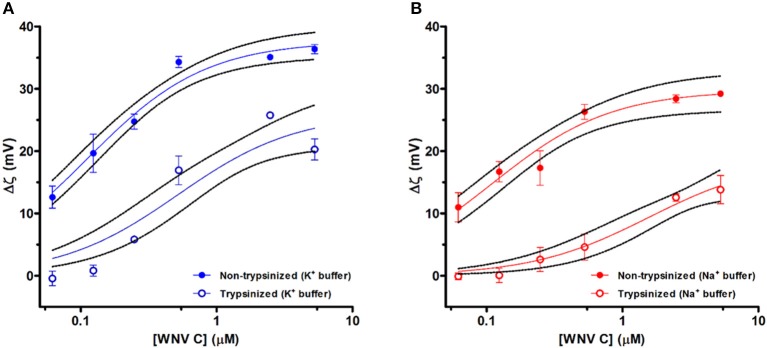
Figure 1.
LDs ζ-potential analysis at different WNV C concentrations. Variation of ζ-potential (Δζ) values of LDs samples isolated with TEE KCl buffer (K+ buffer) (A) and TEE NaCl buffer (Na+ buffer) (B) in the absence and in the presence of distinct WNV C concentrations. ζ-potential values determined for LDs without trypsin preincubation (filled symbols) and LDs pre-incubated with trypsin (empty symbols). WNV C concentration axes are presented in logarithmic scale. Results are presented as mean ± standard error (SE). Experiments were performed in triplicate. Solid lines were obtained by fitting the experimental data using Equation 3. WNV C binds to LDs inducing a progressive increase in the surface charge of the LD-WNV C complex.

