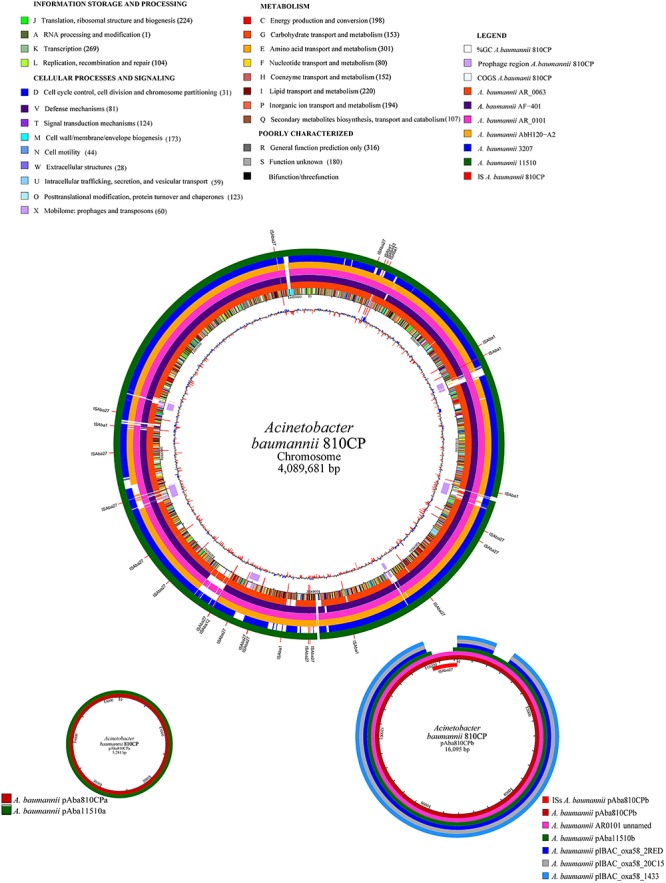
FIGURE 4.

Comparative genome analysis of the A. baumannii 810CP strain. The functional classes are represented in different colors. The number of proteins identified for each functional class is shown in parentheses. The A. baumannii genome and plasmids that were compared with the A. baumannii 810CP strain are shown in different colors.
