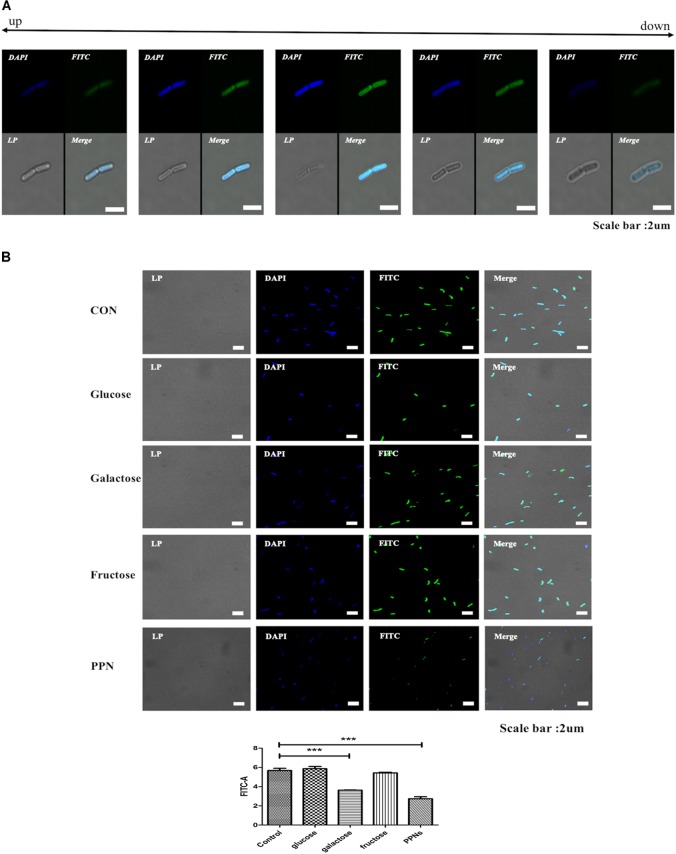
FIGURE 3.
Analysis of the internalization of PPNs by LP. FITC-PPNs are shown in green, and LP was stained blue with DAPI. The internalization of PPNs after 2 h of treatment was quantified by FACS and statistically analyzed. Z-section images show the internalization of corresponding PPNs into LP (A). Analysis of the internalization of PPNs by LP depending on transporters (B). LP, pre-incubated with 10% (w/v) glucose, fructose, galactose or PPN3 was treated with 0.5% (w/v) FITC-PPN3 for 2 h at 37°C, and internalization was observed by CLSM and FACS. Confocal and FACS data are representative of three independent experiments, and the average values are presented as the mean ± SEM of three independent FACS experiments in a bar chart. Statistical significance was analyzed between each group by one-way ANOVA and Tukey’s t-test (∗∗∗p < 0.001). Scale bar = 10 μm. (LP: Lactobacillus plantarum, PPN: phthalyl pullulan nanoparticle, CLSM: confocal laser scanning microscopy, FACS: fluorescence-activated cell sorting, FITC: fluorescein isothiocyanate, DAPI: 4′,6-diamidino-2-phenylindole).

