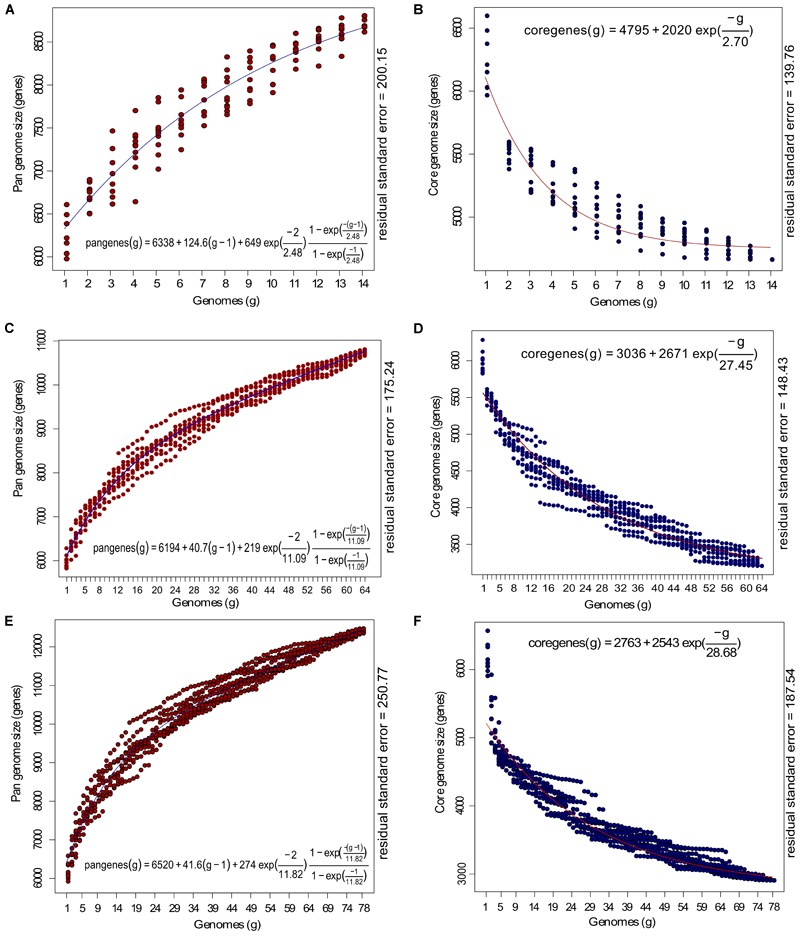
FIGURE 3.

Estimation of core and pan-genome of P. aeruginosa strains with Tettelin fit (blue: pangenome; red: core-genome). (A,B) Represents the estimate of the pan and core genome of 14 outlier strains; (C,D) represents the estimate of core and pan-genome of 64 P. aeruginosa strains included in the current study and (E,F) represents estimate of the core and pan-genome curves for 78 genomes. The x-axis represents the number of genomes (g) while the y-axis represents the core genome and pan-genome size (number of genes). The equation for estimating pan and core-genome size according to Tettelin fit are given with the respected graphs.
