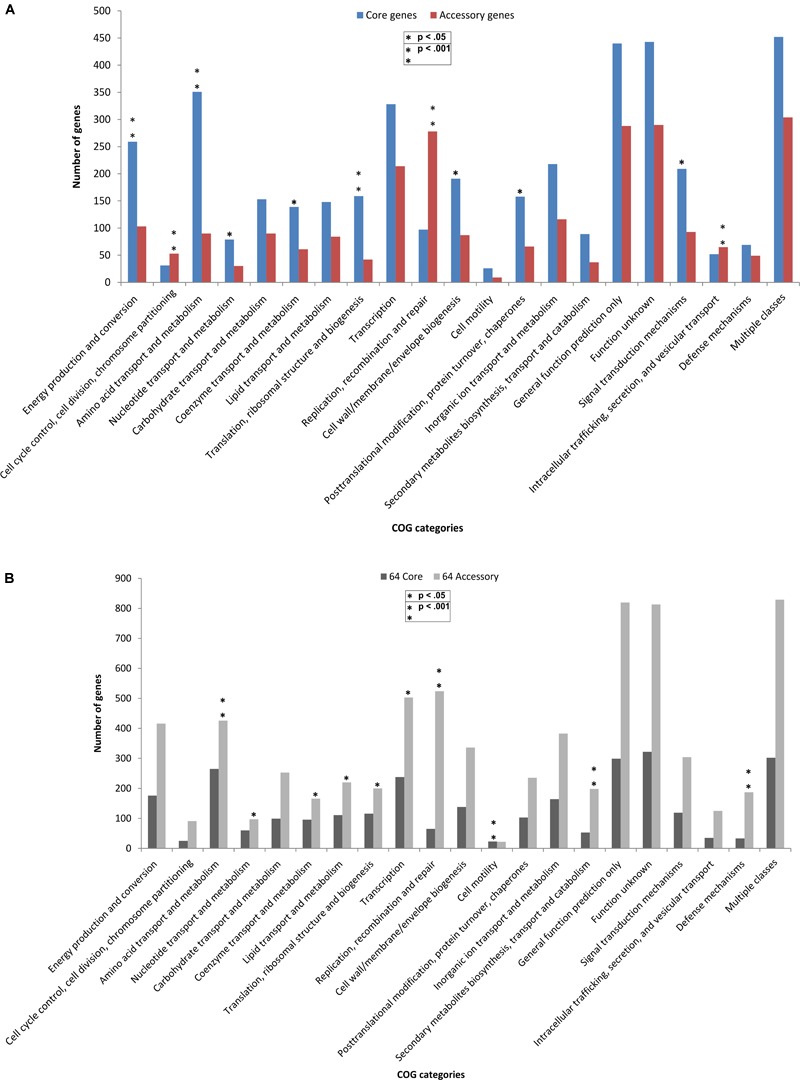
FIGURE 4.

Comparative functional analysis based on COG categories between core and accessory genes in (A) outlier strains (n = 14) and (B) classical strains (n = 64). COG-based binning of core genes and accessory genes. The abscissa denotes different COG functional categories. The ordinate denotes the number of genes in each COG category. Four COG functional categories (RNA processing and modification, Chromatin structure and dynamics, Extracellular structures, and Cytoskeleton) including only one or without homologs in the COG collection are not displayed. Significant enrichment of gene occurrence in the individual category is marked by asterisks (∗p < 0.05, ∗∗p < 0.001; FDR < 10% Chi-square test).
