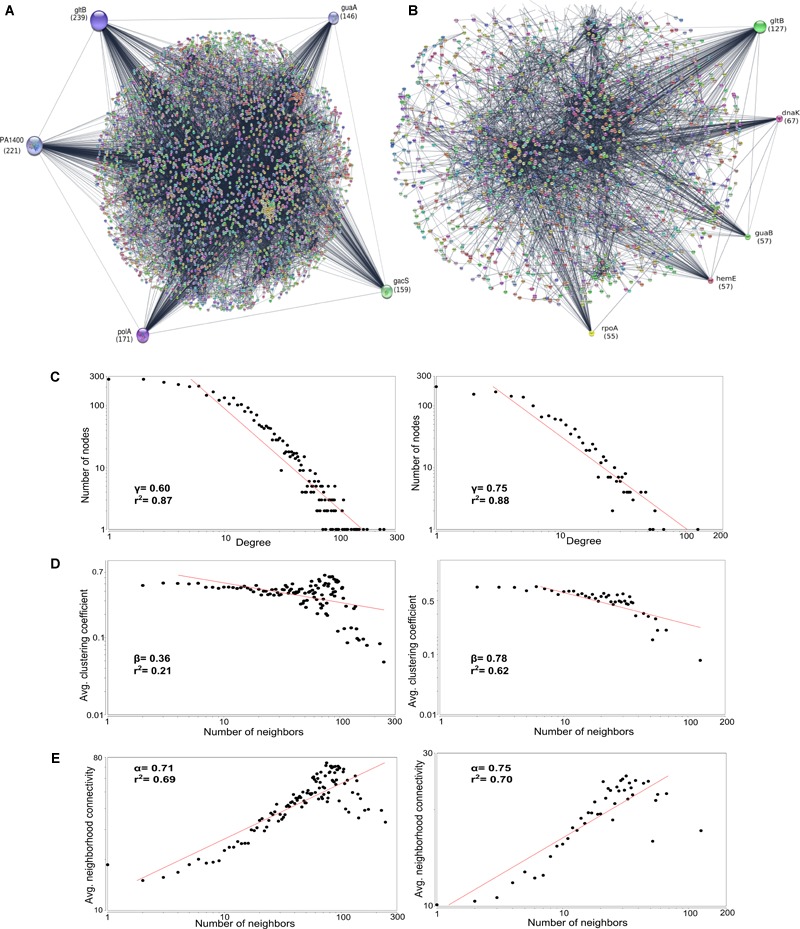
FIGURE 7.

Protein–Protein Interaction network of (A) Core genes of outlier strains (n = 14) and (B) Core genes of classical strains (n = 64). The circles represent protein hubs and line represent edges. The radius of major regulatory hubs decreases as the number of interactions decreases. The topological properties of these networks depicting the correlation coefficient values (r2). (C) Node degree distribution, (D) average clustering coefficient, (E) average neighborhood connectivity. All these properties follow the power distribution and show the nature of the scale-free network and hierarchical organization.
