Figure 1.

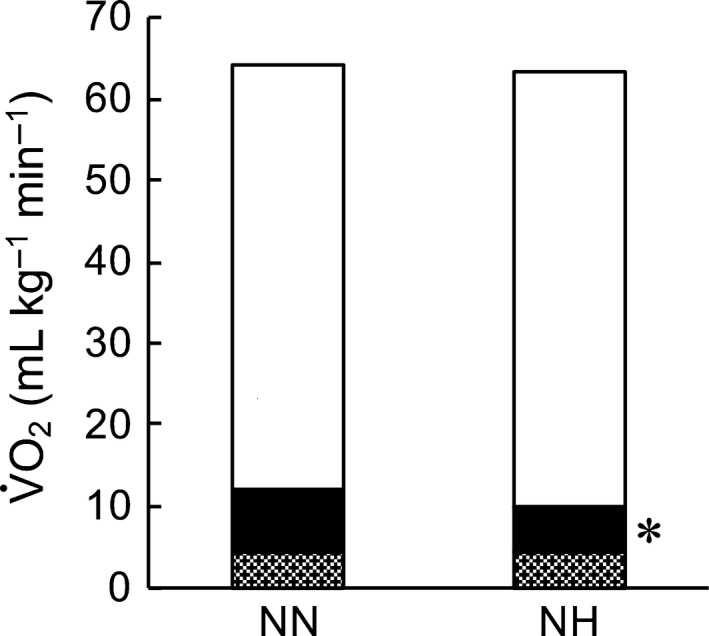
Estimated oxygen consumption at O2max. Grey area shows O2 at rest, the black area shows the O2 of the respiratory muscles, and the white area shows other tissues. NN, normobaric normoxia; HN, hypobaric normoxia. *P < 0.05 versus NN.

Estimated oxygen consumption at O2max. Grey area shows O2 at rest, the black area shows the O2 of the respiratory muscles, and the white area shows other tissues. NN, normobaric normoxia; HN, hypobaric normoxia. *P < 0.05 versus NN.