Figure 1.

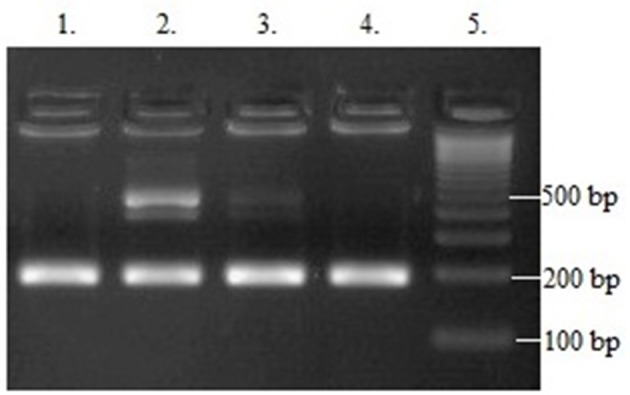
Results of ACE (I/D) gene polymorphism analysis: Line 1 and 4−190 bp band (DD homozygote); Line 2 and 3−190 and 490 bp bands (ID heterozygote); Line 5—leader marker (100 bp).

Results of ACE (I/D) gene polymorphism analysis: Line 1 and 4−190 bp band (DD homozygote); Line 2 and 3−190 and 490 bp bands (ID heterozygote); Line 5—leader marker (100 bp).