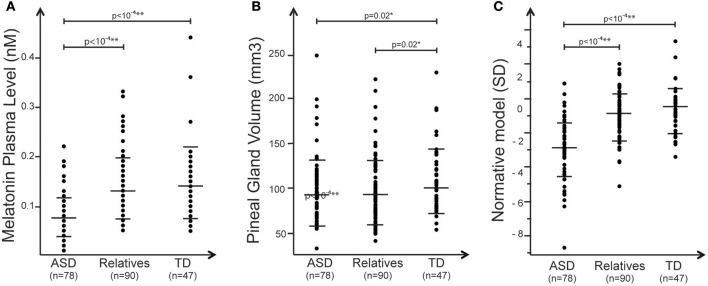
Figure 1.
Summary of the main effects observed in the study. Plots of (A) melatonin (nM) measured for each group (B), pineal gland volume distribution (mm3), and (C) melatonin normative model of melatonin corrected for PGV. In all panels, black dots represent the individual data, and horizontal long and short bars are, respectively, mean and standard deviations.

