
Figure 3.
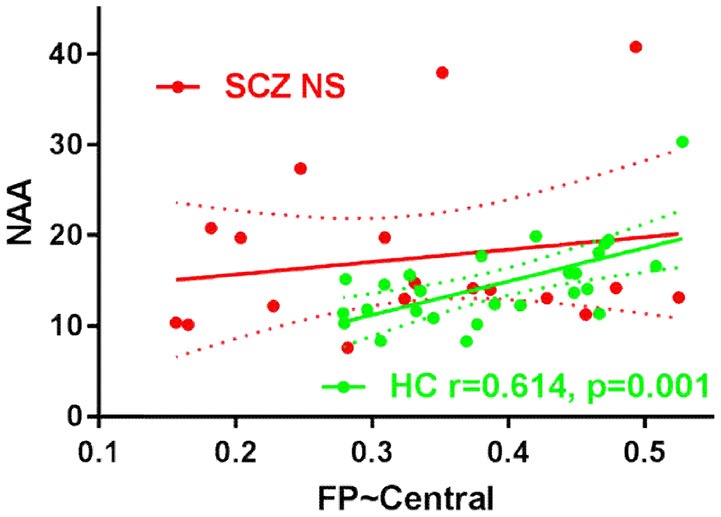
The scatter plots of the correlation FP-Central and NAA in HC group and SCZ group. NS, not significant.
Official websites use .gov
A
.gov website belongs to an official
government organization in the United States.
Secure .gov websites use HTTPS
A lock (
) or https:// means you've safely
connected to the .gov website. Share sensitive
information only on official, secure websites.
The scatter plots of the correlation FP-Central and NAA in HC group and SCZ group. NS, not significant.