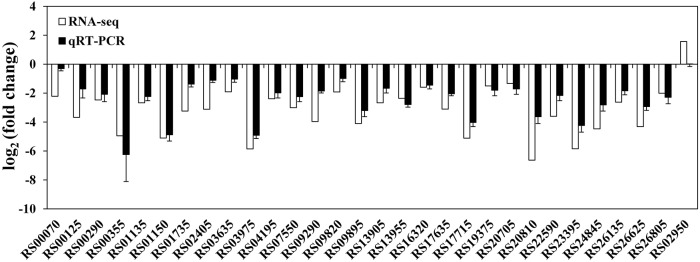
Figure 1.
Validation of RNA-seq data using qRT-PCR. White bars represent RNA-seq data, while the black bars represent mean values of log2 (fold change) observed for the rpoS mutant samples vs. the wild-type samples. The qRT-PCR results are the mean of three biological replicates with three technical replicates for each gene. Error bars represent standard deviation.

