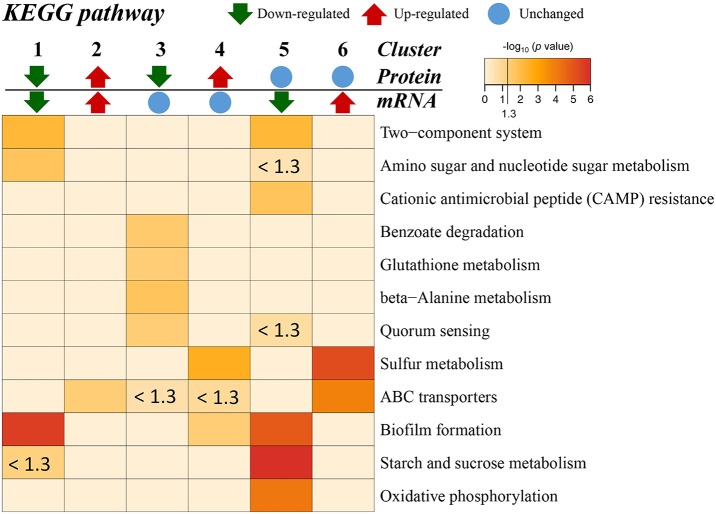
Figure 5.
KEGG pathway enrichment for different categories based on protein-mRNA regulation types. 1, the cluster with protein and mRNA both downregulated in the mutant; 2, the cluster with protein and mRNA both upregulated in the mutant; 3, the cluster with only protein downregulated in the mutant; 4, the cluster with only protein upregulated in the mutant; 5, the cluster with only mRNA downregulated in the mutant; 6, the cluster with only mRNA upregulated in the mutant. The pathways with p < 0.05 [–log10 (p) > 1.3] are considered significant. The color intensity presents the enrichment level as shown in the bar of –log10 (p). The deep red color codes represent the remarkable enriched pathways. The pale yellow in background represents there is no enrichment in the corresponding pathway.

