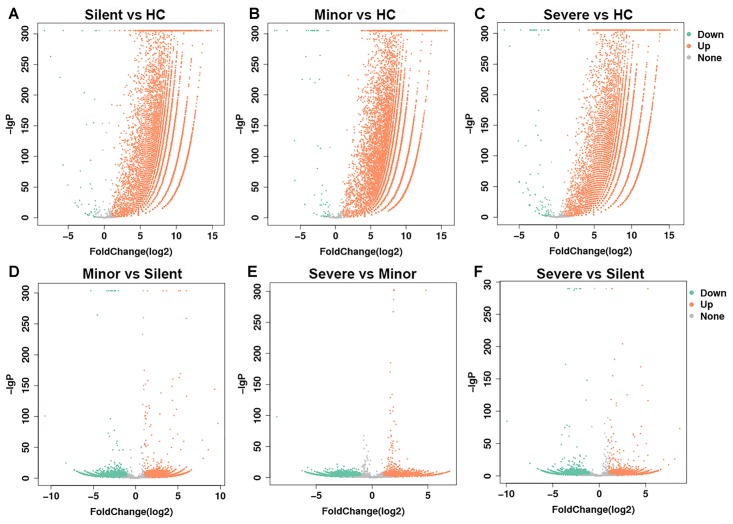
FIGURE 1.
Volcano plot of gene expression changes. The transcriptomes of PBMCs from HAdV-55-infected patients and healthy controls were compared to each other (A–F, the comparison pairs were noted as the caption of every single volcano plot). The x-axis indicates the fold-changes. The y-axis displays the negative logarithm to the base 300 of the t-test p-values. Orange and green dots represent probe sets for transcripts expressed at significantly higher or lower levels in each comparison. HC: healthy control. Silent: patient without any symptoms. Minor: patient with respiratory tract infection symptoms but without pneumonia. Severe: patient with pneumonia.

