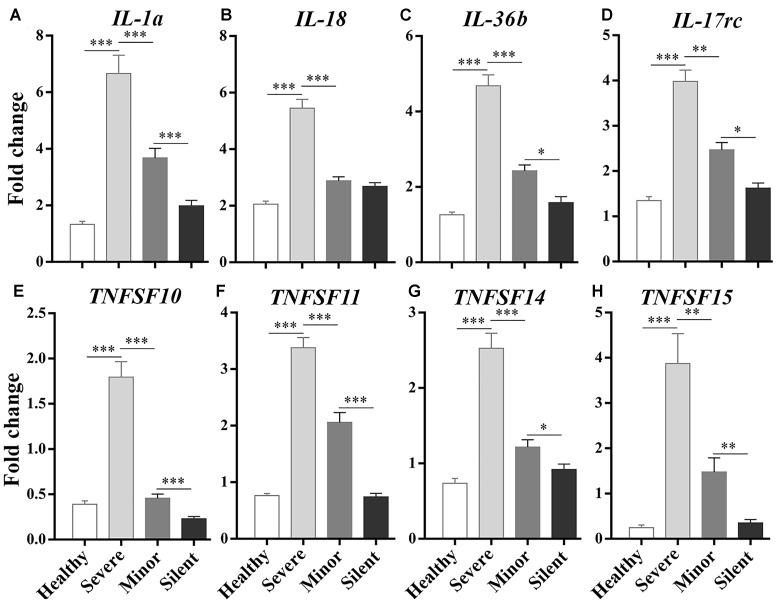
FIGURE 3.
RT-qPCR analysis on the correlations between the expression of inflammatory/immune response genes and the severity of infection. Healthy: healthy control. Silent: patients without any symptoms. Minor: patients with respiratory tract infection symptoms but without pneumonia. Severe: patients with pneumonia. N = 5∼6 per group. ∗p < 0.05; ∗∗p < 0.01; ∗∗∗p < 0.001.

