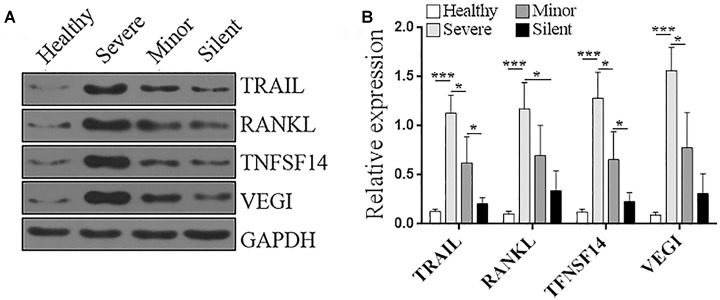
FIGURE 4.
Protein levels of TRAIL, RANKL, TNFSF14, and VEGI in the PBMCs of patients and healthy donors. (A) Representative Immunoblotting images. (B) Statistics for the protein level of each molecule. The relative expression of each protein was normalized to the GAPDH expression. Healthy: healthy control. Silent: patients without any symptoms. Minor: patients with respiratory tract infection symptoms but without pneumonia. Severe: patients with pneumonia. N = 5 per group. ∗p < 0.05; ∗∗∗p < 0.001.

