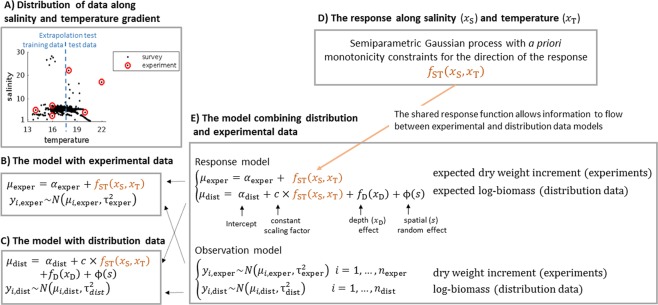
Figure 1.
Summary of the noncausal distribution and causal experimental data (A) and the SDMs with alternative data (B–E). Panel E shows the model where both Fucus biomass data (distribution) and growth data (experimental) are combined. The key component of the model is the response function along salinity and temperature (D) which is shared between the model’s experimental and distribution data components. This allows integrating the information from these two information sources. The rest of the model components are specific to either experimental or distribution data and explain the mean level of data (intercept) and the structured (effect of depth and spatial random effect) and unstructured (Gaussian noise) variation in observations not explained by temperature and salinity. When analyzing experimental (B) and distribution data (C) separately we used only the respective model components from the combined model (E) in which case information from only either one of the data sources is used to learn the response along salinity and temperature. The alternative models were compared in interpolation and extrapolation scenario by training the models with experimental data and a subset of the distribution data (training data) and predicting to the left out distribution data (test data). In interpolation tests, distribution data were divided at random and in extrapolation tests the data were divided at 17.5 degrees temperature (blue dashed line in A). The Fucus presence/absence model follows independently the same hierarchical structure as presented here. The Idotea model is otherwise similar but instead of depth it includes the effect of Fucus biomass in the distribution data model.

