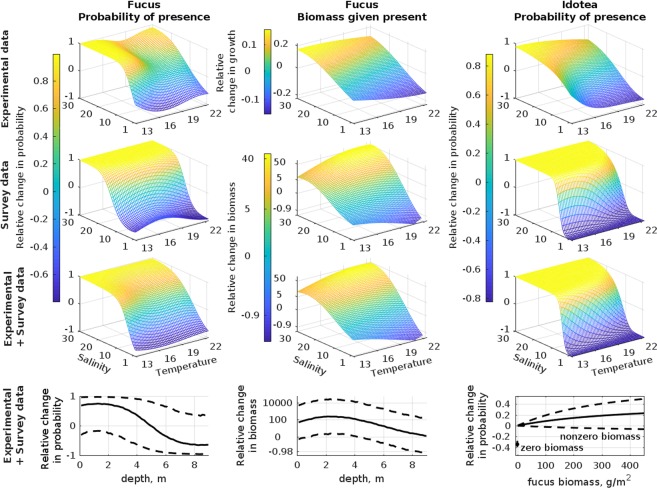
Figure 2.
The response of distribution along covariates. The left column shows the relative chance of probability of Fucus presence compared to 0.5 probability (an equal chance of occurring or not occurring). The middle column shows the change in Fucus growth (experiment) or biomass (survey) given it is present relative to the average growth rate in experimental data or the average biomass in survey data. The third column shows the relative change in probability of occurrence of Idotea (compared to 0.5 probability). The surface plots (first three rows) show the posterior median for the three models considered (the experimental data model, the distribution data model and the model combining the experimental and distribution data). The last row shows the posterior median and 95% credible interval along depth (Fucus model) and Fucus biomass (Idotea model).

