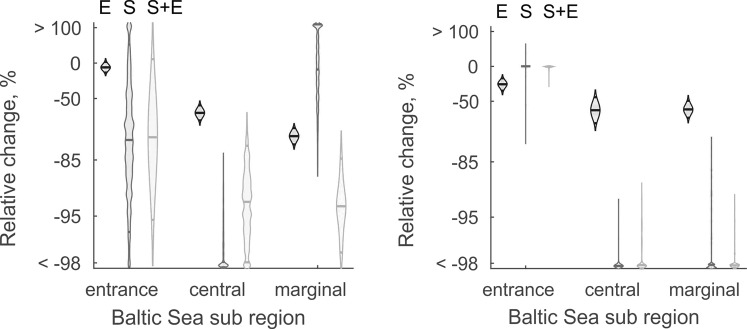
Figure 3.
The climate change induced shifts in the Fucus mean growth and biomass (left) and the probability of occurrence of Idotea (right) in three regions of the Baltic Sea. E denotes experiment, S survey and S + E combined models, respectively. The panels show the relative difference under climate change compared to current conditions (that is: (future-current)/current). In each mark, lines show the posterior expected difference and the 95% credible interval and the shape of the mark indicates the shape of the posterior distribution.

