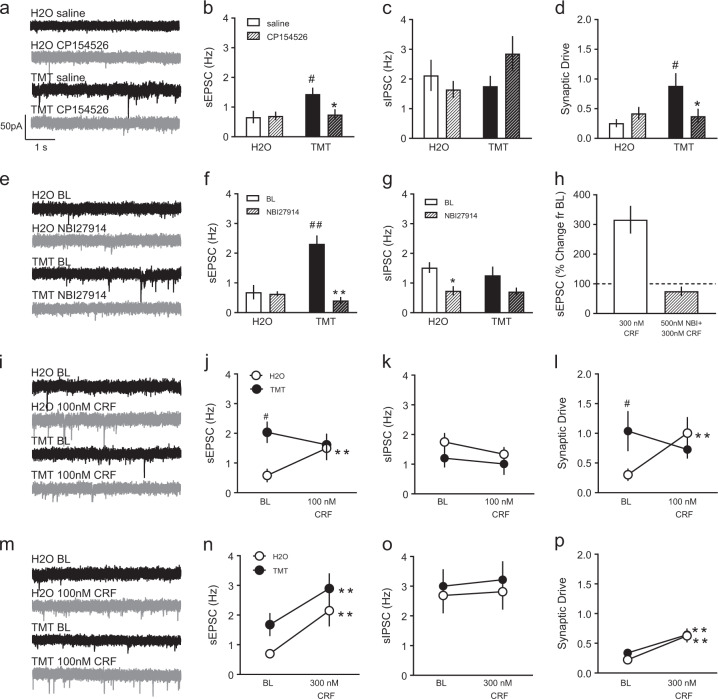
Fig. 5.
Separate mice were pretreated with 10 mg/kg CP154526 (striped) or saline (non-striped) before H2O or TMT. Representative sEPSC traces after saline (black) or CP154526 (gray) injections are shown in a. Electrophysiological recordings of b sEPSC frequency (Hz), c sIPSC frequency (Hz), and d synaptic drive. *p < 0.05 vs. saline. #p < 0.05 vs. H2O. Of the n = 16 mice used in cohort 3, n = 10–12 total cells/group were collected from n = 4 mice/group. To address PL 2/3-specificity of CRF-R1 effects, synaptic transmission was assessed after baseline (black) and NBI27914 (gray) bath application, depicted are sPESC in e. NBI27914 (striped) was applied to H2O (white) and TMT (black) slices compared to baseline (solid) f sEPSC frequency and g sIPSC frequency. *p < 0.05 vs. BL. **p < 0.01 vs. BL. ##p < 0.01 vs. H2O. h In H2O mice, the effects of 300 nM CRF on sEPSC frequency (percent change from baseline) was blocked by 500 nM NBI27914 bath application. Bath application of 100 nM CRF affected synaptic transmission in H2O- (white) and TMT-exposed (black) PL 2/3 cells as indicated by i) sEPSC traces after baseline (black) or CRF (gray), j sEPSC frequency (Hz), k sIPSC frequency (Hz), and l) synaptic drive. Bath application of 300 nM CRF affected synaptic transmission in PL 2/3 of the same groups shown in panel m after baseline (black) and CRF (gray) and as measured by n sEPSC frequency, o sIPSC frequency, and p synaptic drive. **p < 0.01 vs. BL. #p < 0.05 vs. H2O. Of the n = 32 mice from the region-specific experiments in cohorts 1 and 2, n = 8–10 total cells/group were collected from n = 4 mice/group

