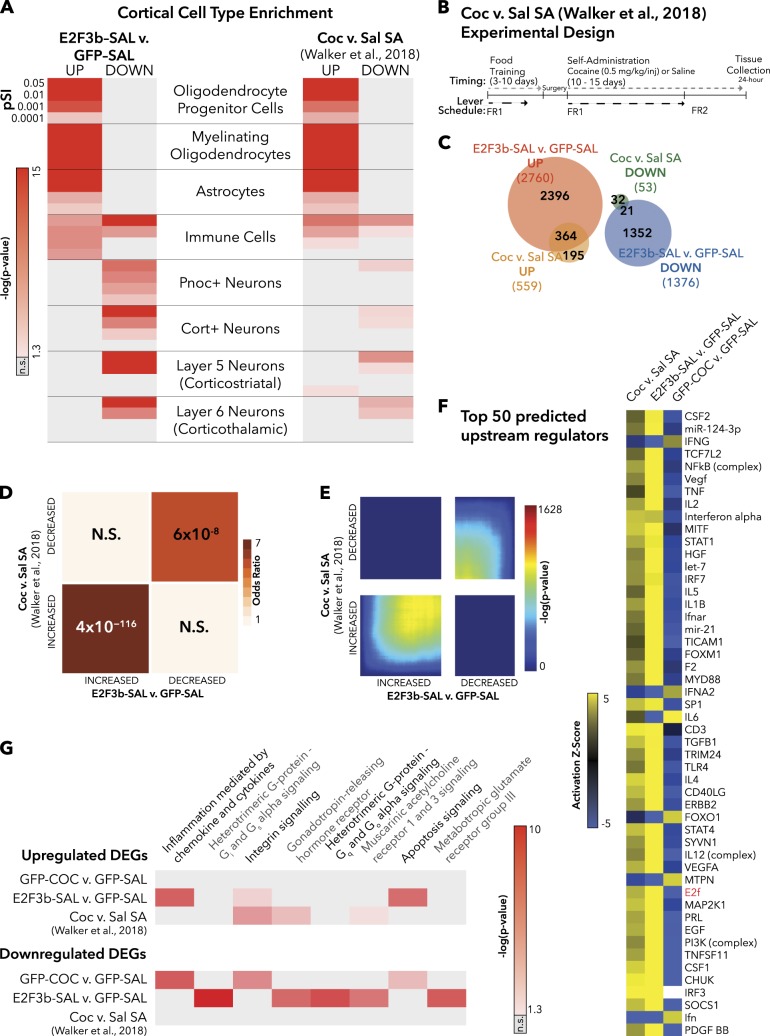
Fig. 3.
E2f3b overexpression in PFC and cocaine SA induce similar transcriptomic profiles. a Cell-type enrichment of E2F3b-SAL and chronic cocaine SA (Coc vs. Sal SA) [11]. pSI = Specificity Index thresholds of varying stringency (e.g., pSI < 0.01 identifies a larger number of enriched transcripts, pSI < 0.0001 is a shorter list of transcripts more specific to the cell type). p-Value is indicated for Fisher’s exact test (FET) with Benjamini–Hochberg correction. b Experimental design for cocaine SA group from Walker et al. [11] study (modified with permission). c Venn diagram depicting the number of DEGs in each group and the amount of overlap. d Matrix summarizes enrichment for genes across the two comparisons using FET, corrected for multiple comparisons. Significant overlap was found between DEGs upregulated in both E2F3b-SAL vs. GFP-SAL and C24 vs. S24 (OR = 7.82, p = 4 × 10−116), as well DEGs downregulated in both conditions (OR = 5.61, p = 6 × 10⁻⁸). e RRHO maps compare threshold-free differential expression between the two gene lists. This analysis shows a significant overlap in genes increased in E2F3b-SAL vs. GFP-SAL and Coc vs. Sal SA (lower left-hand corner) and in genes decreased in both conditions (upper left-hand corner). f The top 50 upstream regulators predicted by IPA are depicted in a heat map. Yellow indicates a positive activation z-score and blue indicates a negative activation z-score. g The pathways predicted by PANTHER with a cutoff of an average of p < 0.05 across all groups. Gray = not significant [37]

