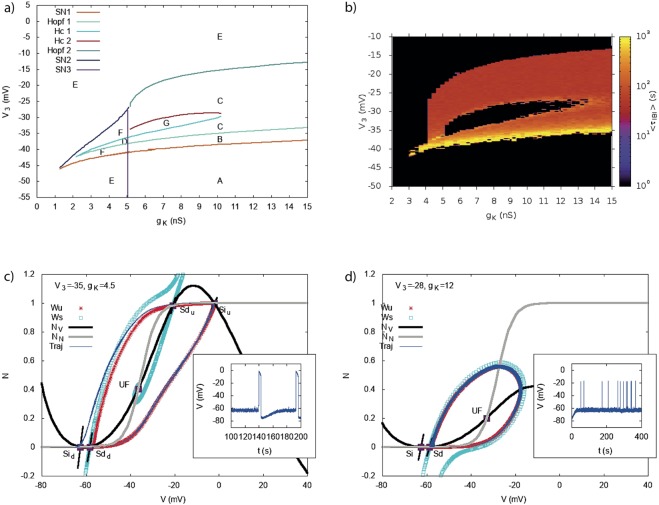
Figure 11.
Bifurcation diagram and heat map of τIBI in the plane V3 − gK. (a) In region A, there is a stable fixed point with low voltage. In B, 2 stable fixed points coexist with a saddle-point. In C a stable fixed point with low voltage coincides with a stable periodic orbit giving rise to fast oscillations. In region D there are 4 fixed points (2 stable, 2 unstable) and a limit cycle. In region E there is a stable fixed point with low voltage and a stable fixed point whose position depends on gK and V3. In region F there are five fixed points, 2 stables. Region G contains 2 stable fixed point (a sink and a focus) separated by an unstable fixed point. Bursting takes place in regions C and D. (b) Heat map of the interburst interval τIBI. Same representation as Fig. 5. We sampled the plane gK, V3 with a step of 0.25 nS on the gK axis and 1 mV on the V3 axis, explaining the irregular shape of the border. (c,d) There is a discrepancy between the heat map and the bifurcation diagram: (i) The bifurcation map does not predict bursting for nS, mV whereas the heat map shows calcium peaks lasting more than 1 s in this region. This is due to the particular structure of the phase portrait of the Morris-Lecar model in this region and the effect of noise, as shown in (c). This phase portrait has two saddles (Sd) down (Sdd) and up (Sdu), and two sinks (Si), down (Sid) and up (Siu). The unstable manifold (Wu, in red) of Sdd connects to Siu, on the right, and to Sid, on the left; The unstable manifold of Sdu connects to Siu, on the right, and to Sid, on the left. Thanks to noise, dynamics can leave Sid and reach Siu where it stays until sAHP rising drive it back to Siu. This is illustrated by the blue trajectory (complete system with noise) which follows the unstable manifolds of the Morris Lecar model. The inset shows the trajectory of the voltage for the complete system in the presence of noise. (ii) (d) While the bifurcation diagram predicts bursting for V3 ~ −28 mV, gK ~ 12 nS, the heat map does not show bursting in this region (black). This is again due to noise. When the cell is on low rest state (Si) noise drives it to the limit cycle, but after a few oscillations, noise drive the cell back to the rest state Sd (see inset for the voltage trajectory). This effect depends on the distance between the two fixed points Si, Sd, fixed by the model parameters, and on the noise intensity σ (here 4 pA ).

