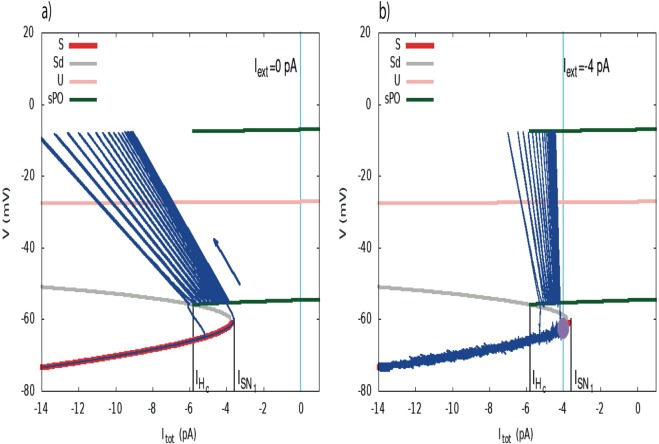
Figure 3.
The two scenarios of triggering bursting. (a) Dynamically driven bursting, Iext = 0. The plot shows a representation of bursting in the plane (Itot, V) (zoom of the bifurcation diagram of Fig. 2, near ISN). Red lines correspond to stable fixed points, gray and pink lines to unstable fixed points, green lines are the extremal values of voltage fast oscillations. Upon this bifurcation diagram, obtained from the reduced model (Morris-Lecar with IsAHP = Itot = constant), we superimpose the trajectory of the full system in the plane (IsAHP, V) (deep blue). The blue arrow indicates the direction of the flow. In the fast oscillations regime V is varying periodically, with a fast period, inducing a fast variation of the term V − VK in the sAHP current, explaining the diagonal motion. Despite these fast oscillations one sees that the bifurcation is driven by the slow motion on the branches obtained from the bifurcation analysis assuming a constant current. The conductance gsAHPR4 is varying slowly, with the time scale of R, explaining the slow left-wise shift of the trajectory until the homoclinic bifurcation point is reached. The cyan vertical line corresponds to the value of Iext = 0. (b) Noise driven bursting. The dynamics has now a stable fixed point (purple circle). An additional current, Iext = −4 pA (vertical cyan line) is now present. Bursting cannot occur without an exogenous excitation, here noise. The amount of noise (controlled by σ) necessary to induce bursting depends on the distance between the fixed point (controlled by Iext) and the bifurcation point .

