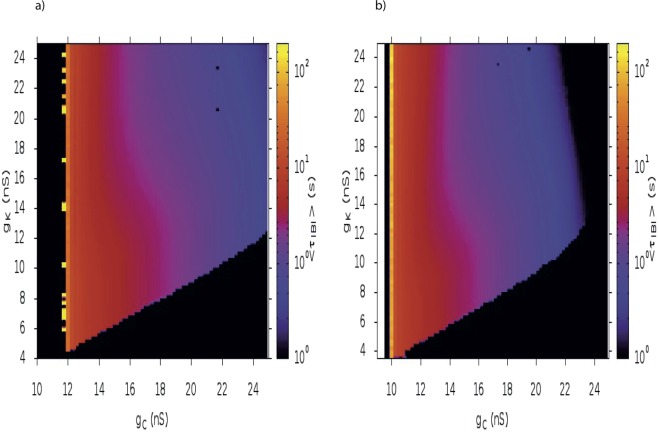
Figure 5.
Heat map of the interburst period as a function of gC and gK. We sample gC, gK on a grid with resolution 0.25 nS. For each point, we generate 20 trajectories of duration 2000 s and count the number of bursts in each trajectory. A period of high calcium activity has to last at least 1 second to be considered as a burst. The heat map show the average value of τIBI in color log scale for a fixed amount of noise σ = 4 pA ms1/2. (a) Iext = −4 pA (noise driven bursting); (b) Iext = 0 pA (dynamically driven bursting).

