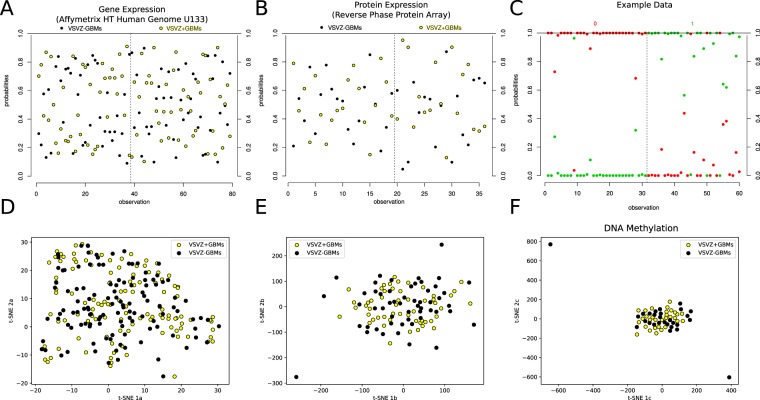
Figure 6.
Computational analyses do not distinguish ventricular-subventricular zone-contacting glioblastomas (VSVZ + GBMs) in the TCIA/TCGA samples. Partial least squares followed by logistic regression (PLS-LR) models trained on two-thirds of samples are unable to reliably predict VSVZ + GBMs and VSVZ − GBMs in the testing subsets in gene (Affymetrix HT Human Genome U133) and protein expression datasets from TCGA. A PLS-LR model is selected and its predictions are depicted in (A,B). Samples (observations) are represented on the x-axis segregated by a vertical dotted line based upon if they are VSVZ + GBMs or VSVZ − GBMs. The model assigns two probabilities (two dots) to each sample of being VSVZ + GBM (yellow) or VSVZ − GBM (black). Therefore, the sum of the probabilities of the two dots per sample is 1. (C) is an example of good predictions made by an artificial model of PLS-LR. Here, samples are represented on the x-axis separated by a vertical dotted line into their binary classification of “0” and “1”. The model assigns two probabilities (two dots) to each sample of being 0 or 1. As seen here, the artificial model successfully predicts all the known 0 (red) samples with a high probability of being 0 and a low probability of being 1; and conversely, all the known 1 (green) samples with a high probability of being 1 and a low probability of being 0. (D–F) represent two-dimensional projection of the high-dimensional gene expression, protein expression, and methylation datasets, respectively, using the t-SNE algorithm (ran with perplexity = 30.0, iterations = 1000). Application of PLS-LR models (linear) or t-SNE (nonlinear multidimension reduction) on molecular datasets does not distinguish VSVZ + GBMs from VSVZ − GBMs.

