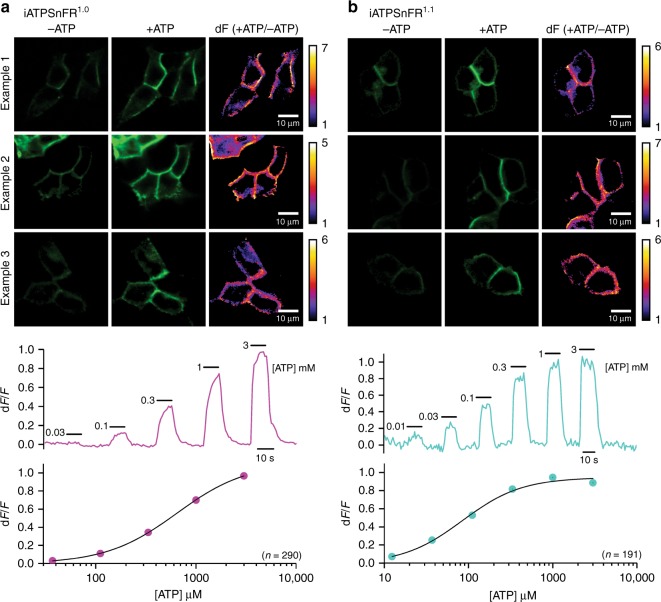
Fig. 2.
Representative images and traces for responses measured with cell surface iATPSnFRs. a The upper panels show three examples of ATP responses for HEK293 cells expressing iATPSnFR1.0. The lower panels show representative traces and an average dose–response curve from 290 cells. b As in (a), but for iATPSnFR1.1. The dose–response curve represents an average from 191 cells. In the dose–response curves, the error bars represent the s.e.m. and in some cases are smaller than the symbols used for the mean. n numbers are provided in the figure panels and refer to the number of cells

