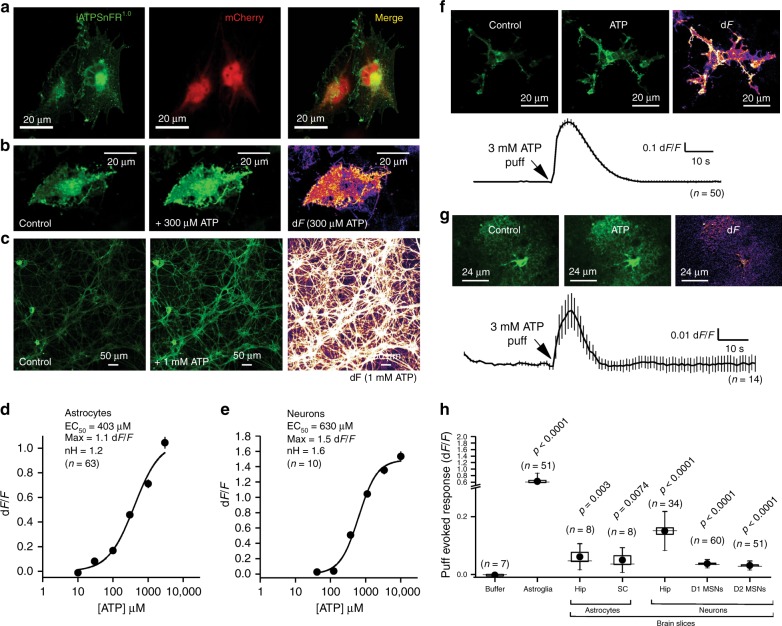
Fig. 5.
Characterization of cell surface and cytosolic iATPSnFR1.0 in astrocytes and neurons. a A single plane from a confocal z-stack of a U373MG cell expressing cytoplasmic mCherry and membrane-displayed iATPSnFR1.0. b Confocal images of U373MG cells expressing iATPSnFR1.0 before ATP application (control) and during a 300 µM ATP application (+ATP), as well as the change in fluorescence (dF). c Confocal images of hippocampal neurons before ATP application (control) and during 1 mM ATP application, as well as the change in fluorescence (dF). d, e Dose–response curves for iATPSnFR1.0 when displayed on the surface of U373MG astroglia and hippocampal neurons. f A confocal image of a U373MG astroglia cell transfected with iATPSnFR1.0 before a 3 mM puff of ATP (control), during the puff (ATP), as well as the change in fluorescence (dF). An average trace from all cells with the s.e.m. is also shown. g Representative hippocampal astrocyte in acute brain slice expressing iATPSnFR1.0 before the application of ATP (control), during the application of 3 mM ATP (ATP), and the dF. An average trace from all cells with the s.e.m. is also shown. h Scatter graph summary of the effect of 3 mM ATP on iATPSnFR1.0 expressed in the cell types indicated. In panel (h), the circle represents the mean, the box the s.e.m., the whiskers the s.d., and the horizontal line the median. p Values are shown for statistical comparisons to the buffer puff control using un-paired Student’s t tests. Abbreviations: hip hippocampus, SC spinal cord, MSNs medium spiny neurons. Note broken y-axis. In other panels, the error bars represent the s.e.m. and in some cases are smaller than the symbols used for the mean. n numbers are provided in the figure panels and refer to the number of cells

