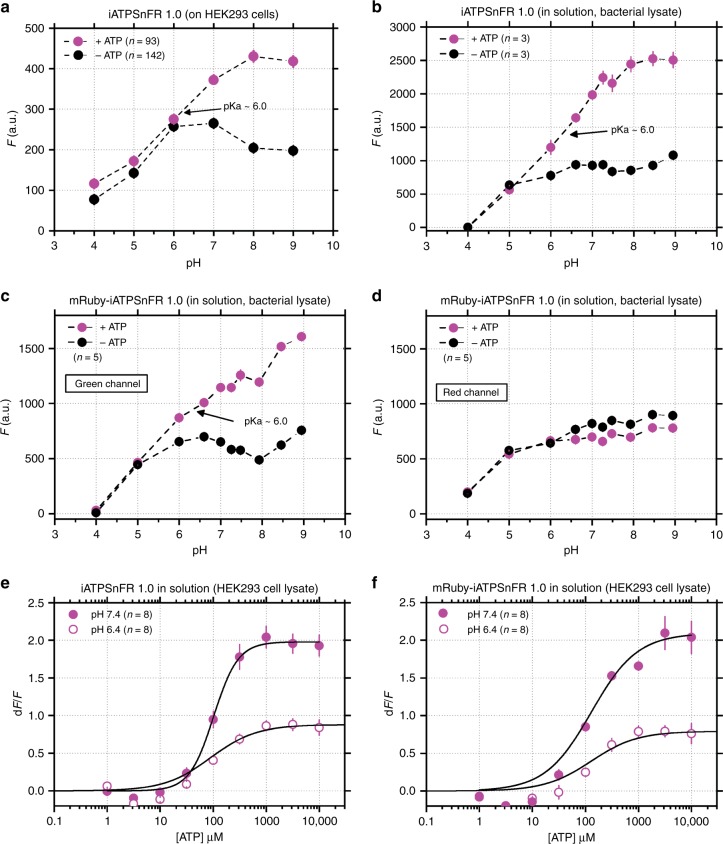
Fig. 7.
Assessments of how iATPSnFR1.0 was affected by pH. a–d Effect of pH on the unbound and ATP bound fluorescence of the indicated constructs. e, f Comparison of the effect of ATP on the fluorescence of the indicated constructs at pH 6.4 and 7.4. The error bars represent the s.e.m. and in some cases are smaller than the symbols used for the mean. n numbers are provided in the figure panels and refer to the number of cells in panel (a), and number of independent evaluations in (b–f)

