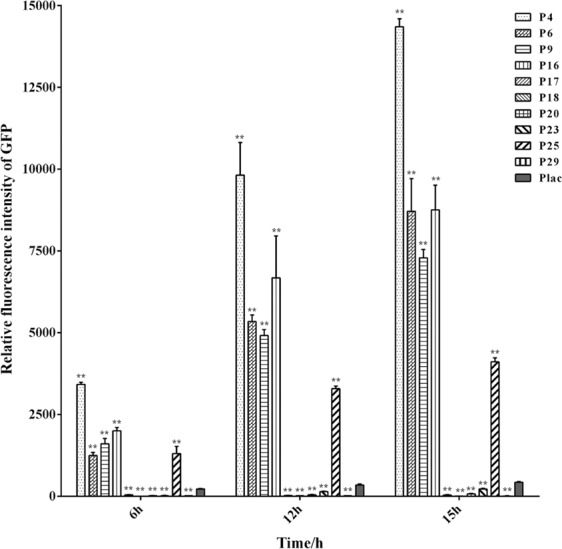
Figure 3.

Characterization of the chosen promoters and lac promoter via GFP fluorescence intensity measurements. Expression of gfp gene under different promoters in P. mendocina NKU was quantified at different growth phases. The background expression was subtracted, and the relative fluorescence intensity was calculated by normalization against per OD600 of whole cells. Data represent the mean values ± standard deviations of triplicate measurements from three independent experiments. A Student’s t-test was performed between lac promoter and chosen promoters. * and ** indicate P < 0.05 and P < 0.01, respectively.
