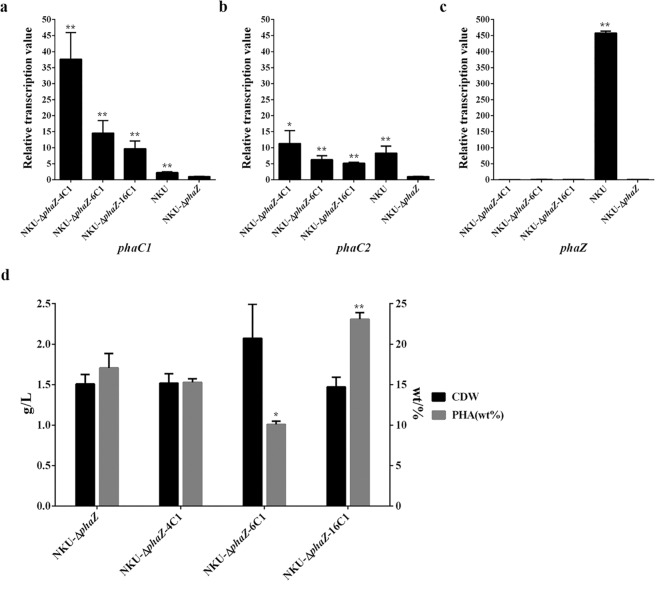
Figure 7.
qPCR analysis and PHA fermentation results for the strains NKU-∆phaZ-4C1, NKU-∆phaZ-6C1, NKU-∆phaZ-16C1 and NKU-∆phaZ. Transcriptional levels of phaC1 (a), phaC2 (b) and phaZ (c) for the different strains. (d) CDW and PHA production for the strains. Samples for qPCR were taken at 36 h of PHA fermentation. The transcriptional level for strain NKU-∆phaZ was set as 1. Data represent the mean values ± standard deviations of triplicate measurements from three independent experiments. A Student’s t-test was performed between NKU-∆phaZ and other mutants. * and ** indicate P < 0.05 and P < 0.01, respectively.

