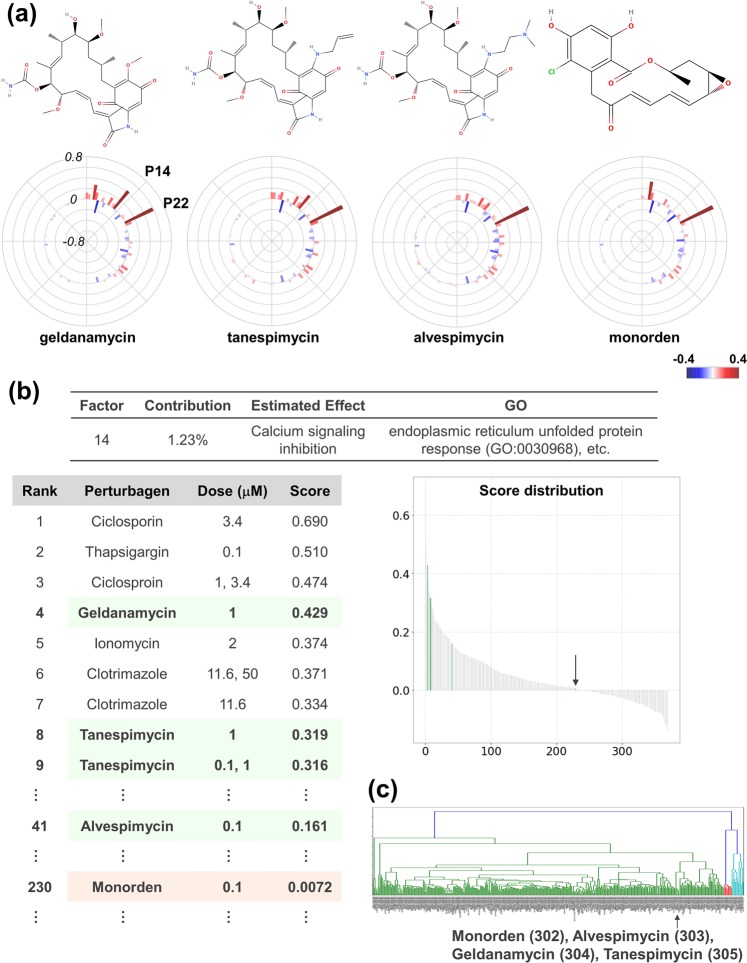
Figure 5.
Decomposition of Hsp90-inhibitor effect. (a) Structures and response scores of Hsp90 inhibitors. Structures were obtained from MolView (http://molview.org/). Response scores are plotted as a bar chart in polar co-ordinates with heatmap. (b) Analysis of the P14 factor. P14 factor scores of all compounds are arranged in descending order and plotted on the “Score Distribution” graph. Green with an arrow in the graph indicates geldanamycin-type inhibitors and light salmon with an arrow indicates monorden. The rank, name, dose, and score are shown. (c) Clustering analysis of MCF7 cells data set of CMap. The MCF7 cells data set of CMap was subjected to clustering analysis with the Ward method. An arrow indicates the cluster where Hsp90 inhibitors belong. The numbers following the compound names indicate the ordinal numbers from the left.

