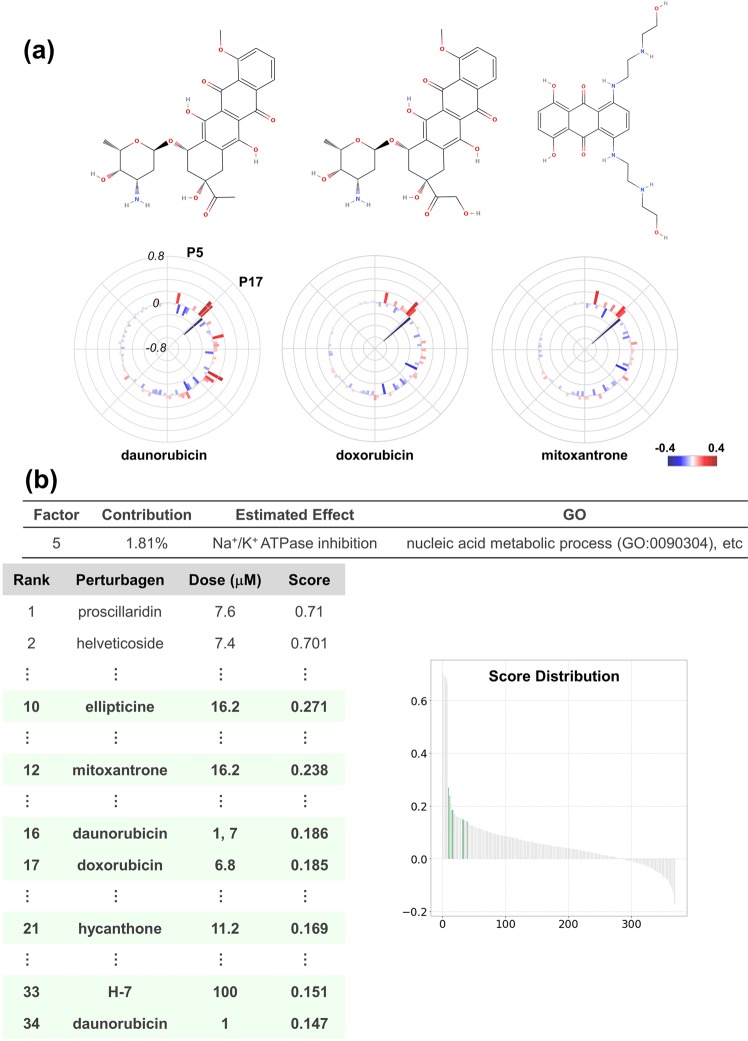
Figure 6.
Decomposition of topoisomerase-inhibitor effect. (a) Structures and polar charts of response scores of topoisomerase inhibitors: daunorubicin, doxorubicin, and mitoxantrone. For daunorubicin, 7 μM-dose data were employed considering the higher effect on the transcriptional network than that of 1 μM. Structures were obtained from MolView (http://molview.org/). Response scores are plotted as a bar chart in polar co-ordinates with heatmap. (b) Analysis of the P5 factor. P5 factor scores of all compounds are arranged in descending order and plotted on the “Score Distribution” graph. Green in the graph indicates topoisomerase inhibitors. The rank, name, dose, and score are shown.

